Submitted by Taps Coogan on the 5th of October 2017 to The Sounding Line.
Enjoy The Sounding Line? Click here to subscribe for free.
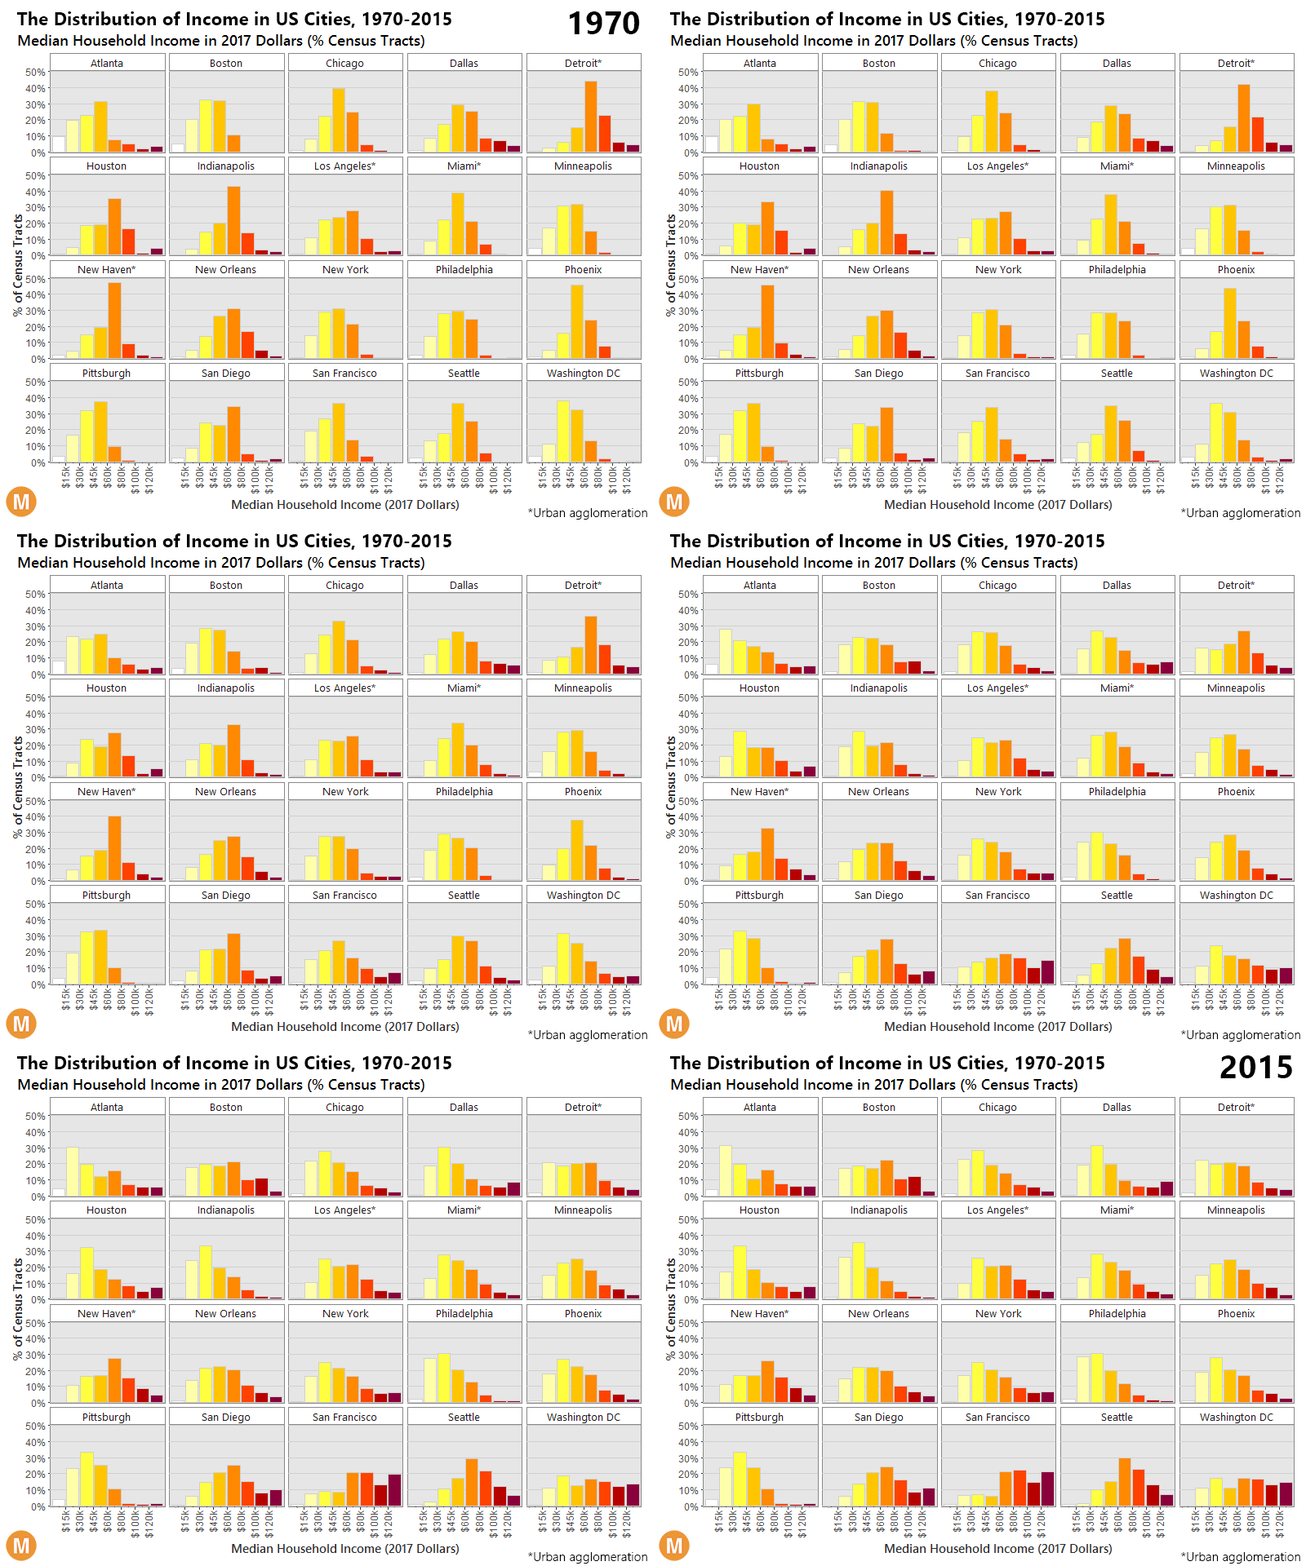
The following chart, from Metrocosm, shows the flattening distribution of median incomes in the 20 largest American cities from 1970 to 2015. When the median income distribution flattens, it means that a greater portion of the population in each of these cities is either poorer or wealthier than they were in 1970 (most are poorer), with comparatively fewer individuals occupying the ‘middle class.’ What is so startling about these charts is how universal the flattening of the US middle class has been. Every single major American city had a bell-curved income distribution in 1970 showing a big middle class and every single city has seen it flattened. Not surprisingly, the flattening is most severe in America’s rust belt cities like Detroit, Pittsburgh, and worst of all New Haven.
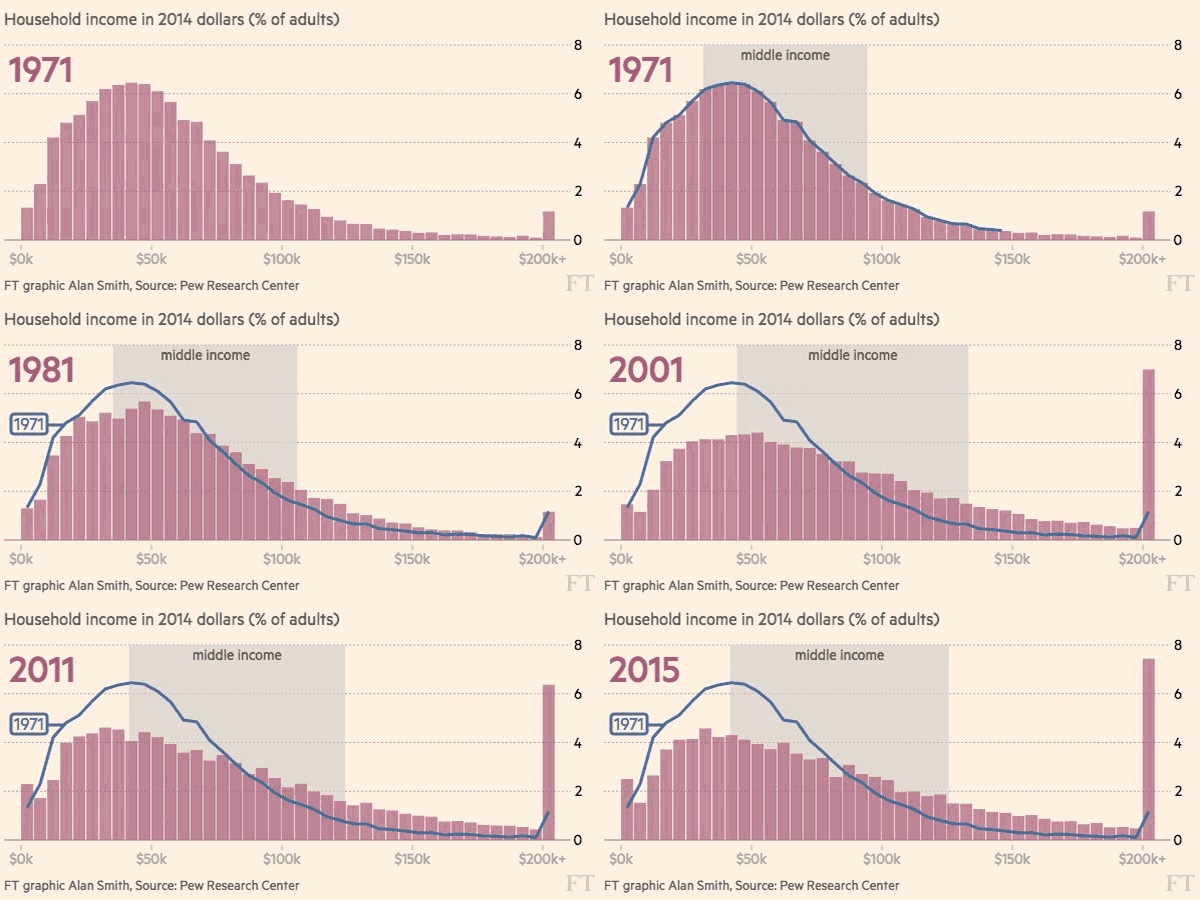
Also via Metrocosm, the following chart from the Financial Times shows the same trend for the nation as a whole. A great portion of America has moved either above or below middle class income levels with the biggest growth occurring among the wealthiest.
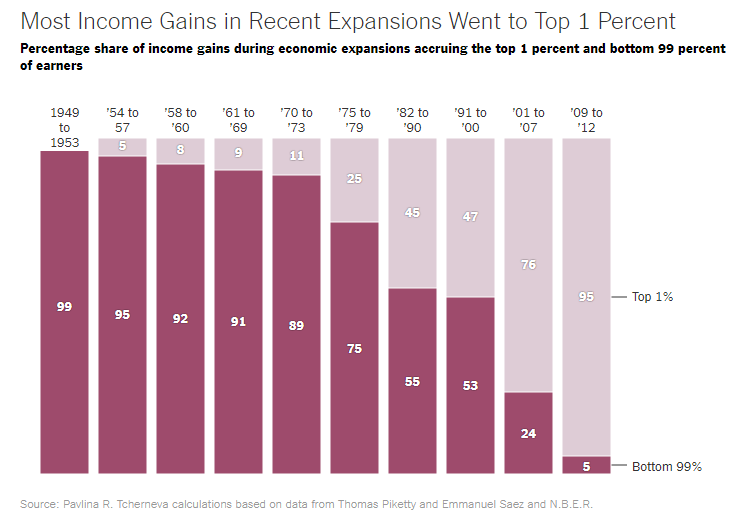
With each economic expansion since World War II, income gains have been more skewed towards the wealthy. An astonishing 95% of the income gains experienced between 2009 and 2012 went to the top 1% of income earners. By comparison the top 1% of income earners captured only 1% of the income gains in the economic expansion from 1949 to 1953.
While the median income of ‘middle class’ Americans has risen since 1970, the portion of Americans in the middle class has fallen steadily. The American economy is increasingly bifurcating between those below or far above the middle class, with fewer and fewer actually in the middle class.
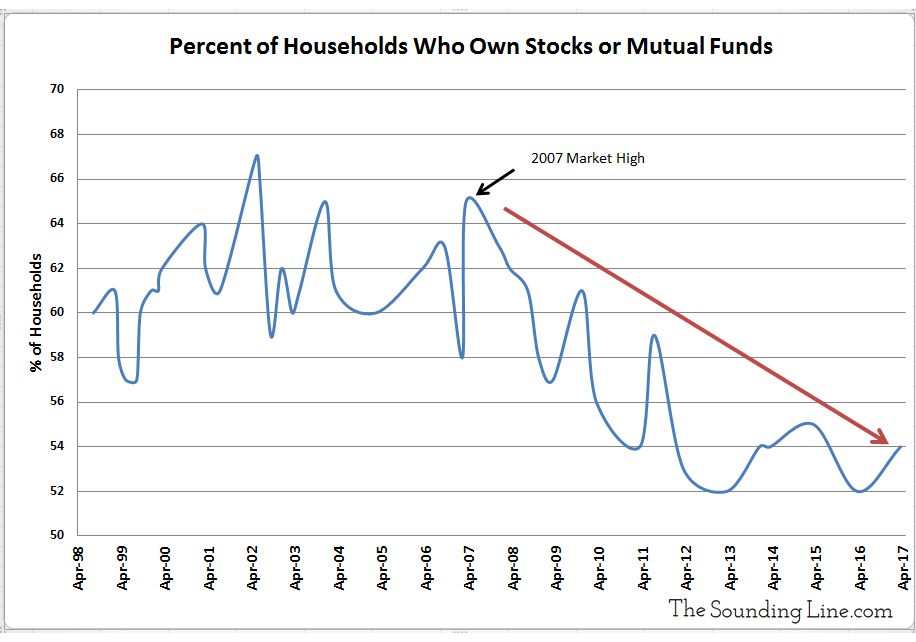
One recent driver of this trend has been the declining percentage of Americans participating in the dramatic appreciation of financial assets since the 2008 financial crisis. While the Federal Reserve’s monetary policy response to the financial crisis succeed in driving up virtually all financial asset prices, the benefit of those appreciating financial assets has fallen to an increasingly small percentage of the population. As we first noted here, the percentage of Americans who report owning stocks is near its lowest level on record.
Similarly, the percentage of American who own homes has fallen despite rising home prices.
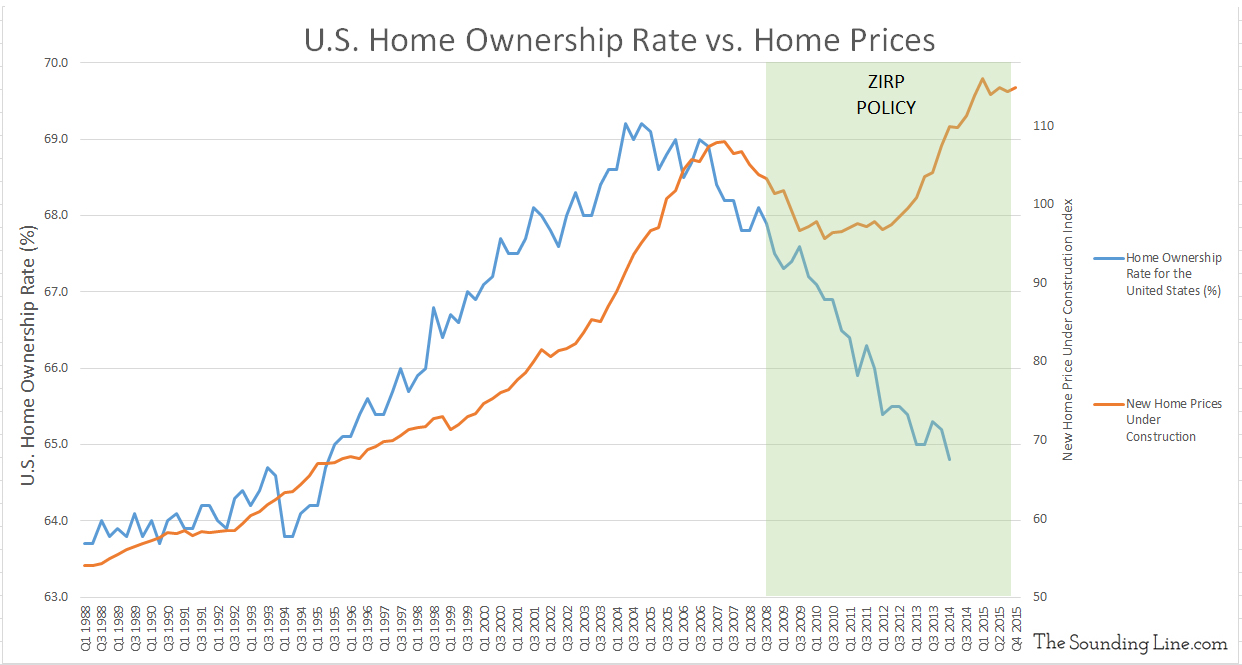
With the prospect of large stock portfolios and financial assets unrealizable for nearly half of Americans living paycheck to paycheck, an economy recovery driven by financial asset appreciation instead of structural economic reform has unsurprisingly contributed to a growing wealth divide.
P.S. If you would like to be updated via email when we post a new article, please click here. It’s free and we won’t send any promotional materials.
Would you like to be notified when we publish a new article on The Sounding Line? Click here to subscribe for free.


Mass production made Henry ford and lord Nuffield very wealthy, but the reach of their goods was relatively small. Today the reach of the technology giants (Bill Gates et al) is huge, therefore the size of their fortunes can be comparatively much greater. We see here the effect of computers on global economies together with increasing globalisation.