Submitted by Taps Coogan on the 11th of April 2016 to The Sounding Line.
Enjoy The Sounding Line? Click here to subscribe for free.
In today’s world of highly massaged and adjusted economic indicators, one way to get a relatively unvarnished perspective on economic trends is to analyze the actual quantity of goods being traded or transported.
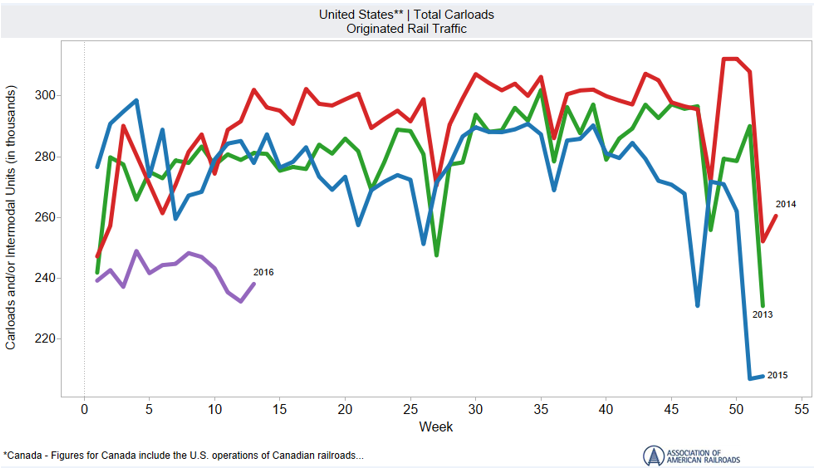
One such indicator comes from the Association of American Railroads (AAR) which periodically publishes statistics about the number of carloads of goods transported via the US railroad system. The most recent publication from the AAR shows a dramatically slower start to 2016.

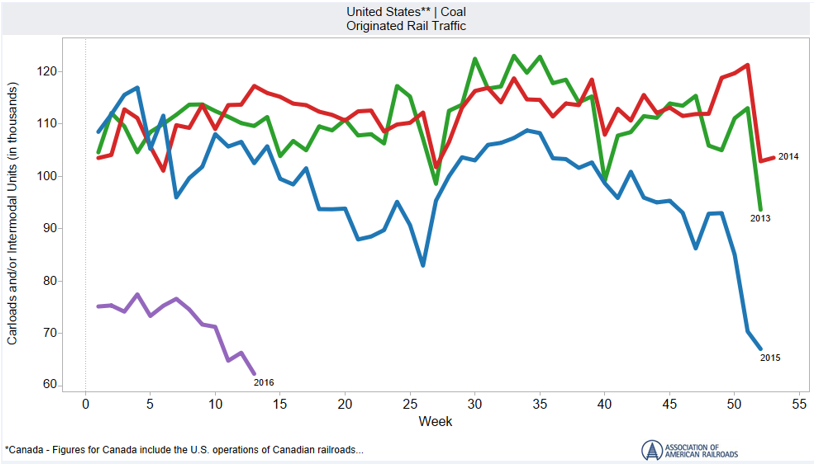
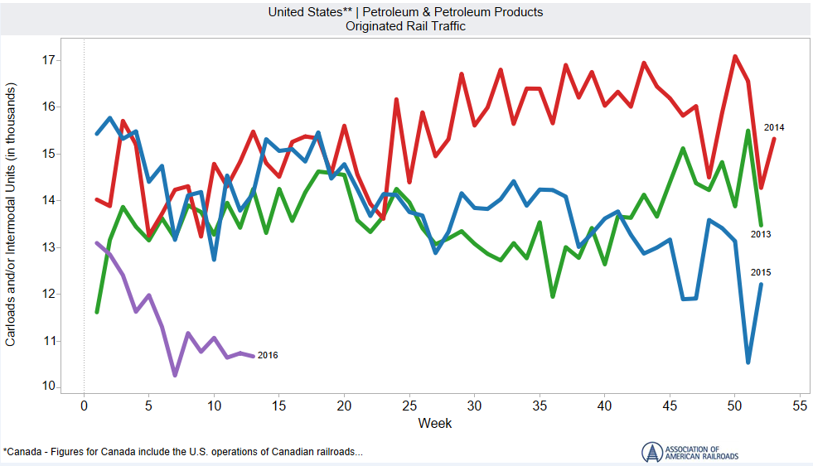
According to the AAR, the overwhelming reason for the low number of carloads is a decline in shipments of coal and petroleum and petroleum products, as shown in the charts below. The AAR noted that of the 20 commodities that they track, 13 had declined in March 2016 versus March 2015.


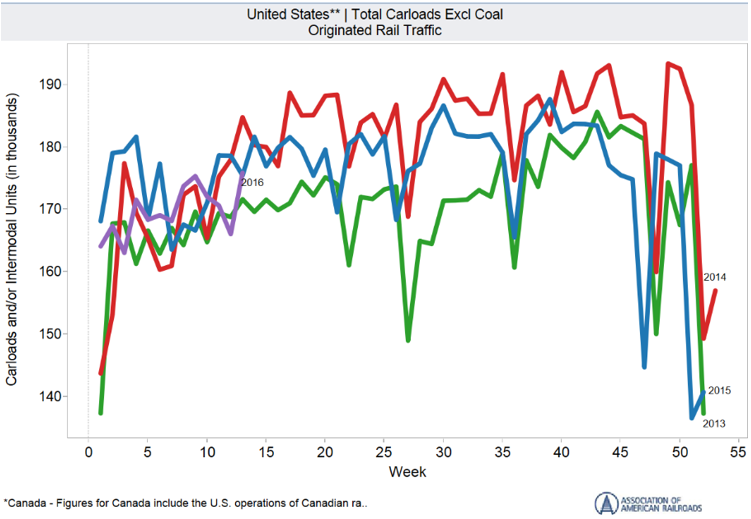
Despite these concerning developments, when excluding coal which comprises the largest element of rail transport, carloads were down a much more modest 1.2% in March with chemicals and automobiles and auto parts posting 5% gains. The chart below reveals that the trend in carloads is more normal when excluding coal.

The data from the AAR highlights the enormous challenges facing the US energy industry, and by extension, the rail industry. Before the downturn in oil prices in 2014, the energy industry had created 400,000 direct and nearly 2 million indirect US jobs since 2003 (link here), far outpacing the rest of the economy. With low oil prices making rail transportation prohibitively expensive compared to pipelines, and with oil production down nearly 6% from the 2015 highs and coal production down much more, the supply side of the US energy industry is clearly reacting to today’s realities. As for the broader economy, the results are more moderated.
Would you like to be notified when we publish a new article on The Sounding Line? Click here to subscribe for free.

