Submitted by Taps Coogan on the 13th of February, 2016 to The Sounding Line.
Enjoy The Sounding Line? Click here to subscribe for free.
Continuing its fall from the $107.23 weekly high in June 2014, West Texas Intermediate (WTI) crude oil prices traded down to $26 a barrel on Thursday of this week. That is a 75% reduction in the price of oil from the high in June 2014.
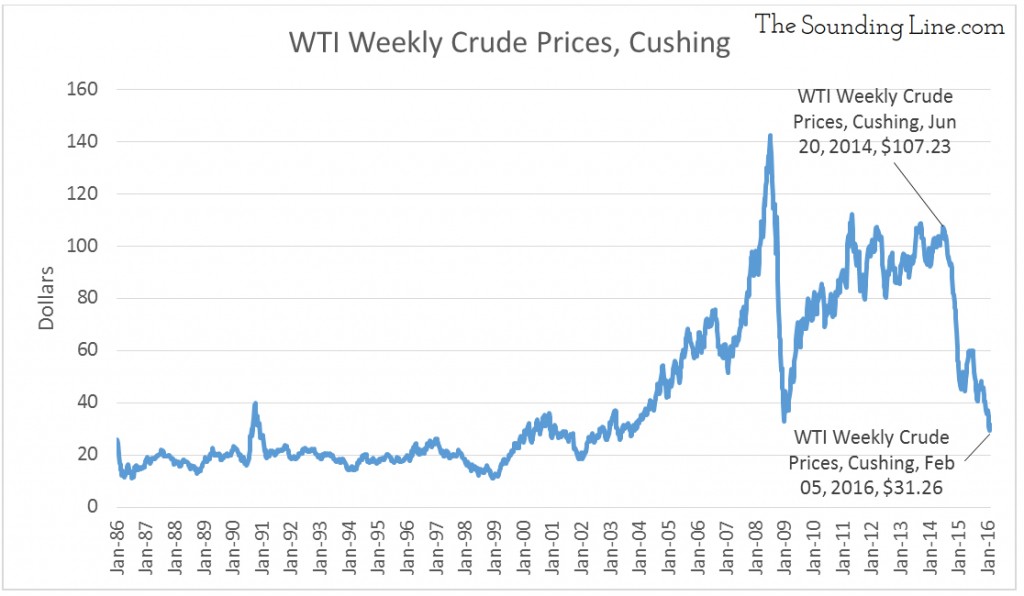
Many theories have been put forth to explain the collapse in the price of oil, each with a degree of credibility. Some of them are:
- Supply increases in the U.S. from tight oil
- Diminishing market share of OPEC and subsequent unwillingness to enforce ‘cartel pricing’
- Weakening global demand, particularly in China
- A strengthening dollar
- A Saudi Arabian ‘market share’ strategy to undermine higher cost producers like U.S. tight oil
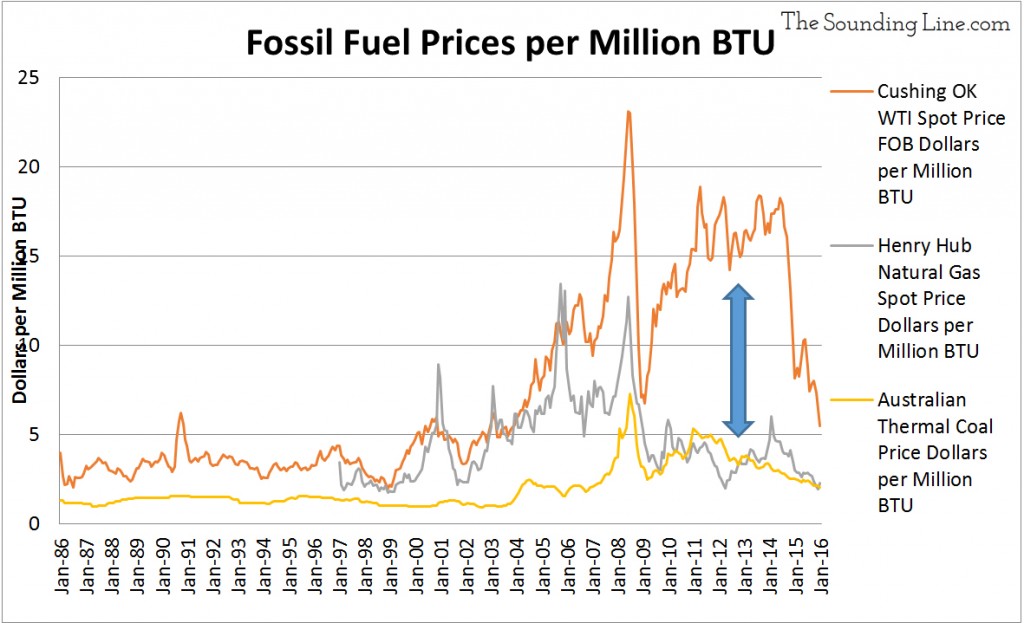
In upcoming articles, we will look more closely at what is causing the deterioration in oil prices. But before doing so, it is worthwhile to establish a historical perspective on oil prices in comparison to other fossil fuels. This perspective is helpful in understanding the trends in all fossil energy, not just oil. It also enables us to see if the price of oil has diverged from the prices of other fossil fuels.
The chart below shows the price per million BTU of energy for the three main fossil fuels: oil, natural gas, and coal. In fact, a large divergence developed between the price of oil and the price of natural gas and coal after the 2008 financial crisis.
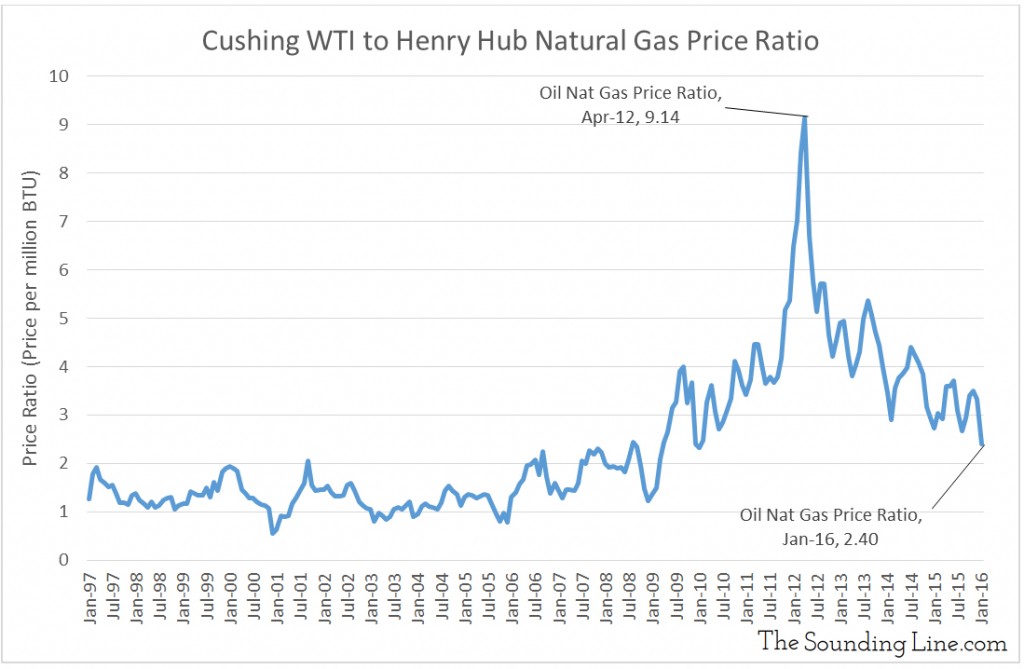
The downward price action in oil since June of 2014 has helped bring its price premium over natural gas closer to normal levels, as shown in the chart below.
One explanation for the divergence that developed between oil and natural gas prices has to do with market structure and it has implications for the potential of a price rebound. The chart below shows that U.S. net natural gas imports started to decline in 2008 despite growing consumption. Fracking increased domestic natural gas production which offset imports. This was closely followed by a collapse in the price of natural gas.
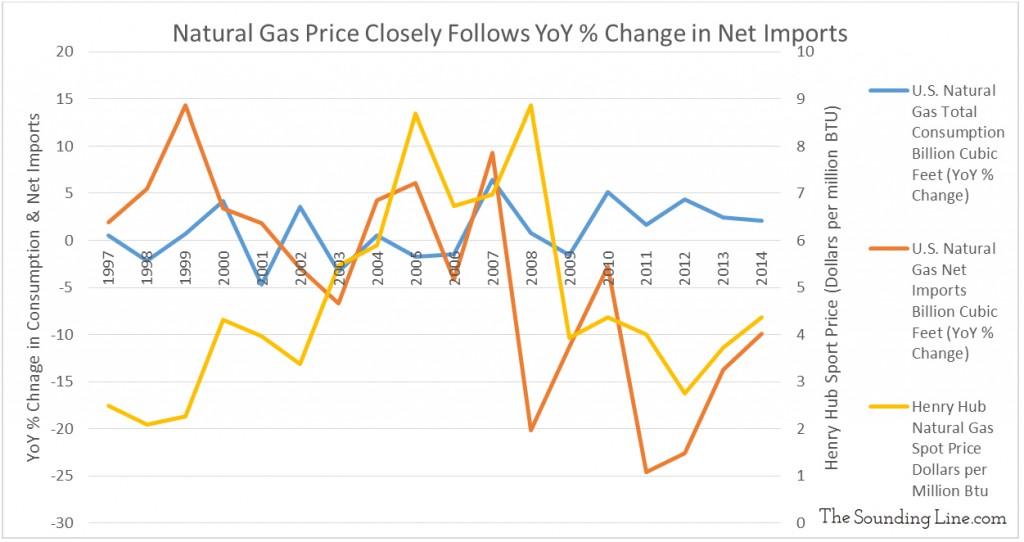
Because natural gas is more difficult and expensive to import, increased domestic production resulted in strong downward pressure on domestic natural gas prices. Oil is easier and cheaper to import and thus imports account for a much larger percentage of U.S. consumption than for natural gas.
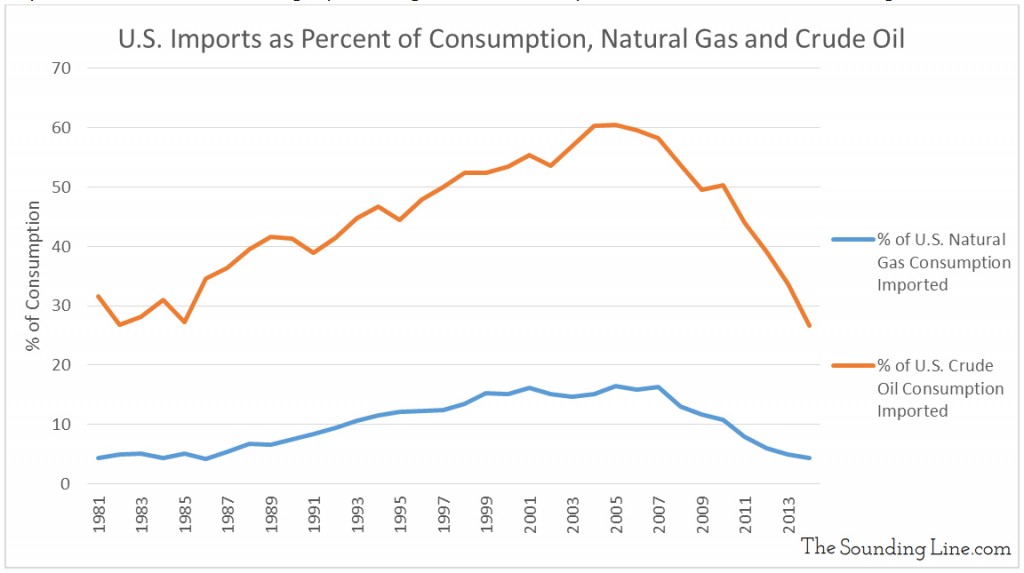
Due to the relative ease of transporting oil and because imports account for a much larger percentage of U.S. consumption, U.S. oil prices have been less closely linked to changes U.S. oil production. In the graph below, we can see that U.S. oil imports started declining in 2006 and, even with stagnant consumption, oil prices remained elevated until 2014.
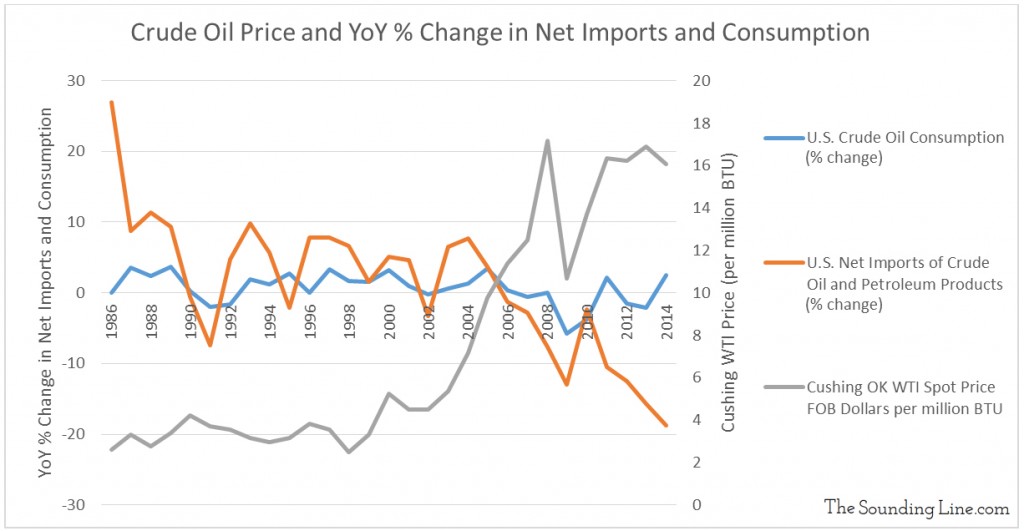
This should provide a warning that when it comes to oil prices, eventual declines in U.S. production, without corresponding declines in overall global production, may not be enough to support higher prices. All of this goes to show that market structure is important when interpreting the past and predicting the future for oil prices. Stayed tuned for a discussion of what changes in the oil market may explain the price decline to date and what could drive the price higher.
Would you like to be notified when we publish a new article on The Sounding Line? Click here to subscribe for free.


[…] ‘Energy Prices – The Crude Oil Divergence’ (link here) we discussed the divergence that developed between crude oil prices and natural gas and coal […]