Submitted by Taps Coogan on the 1st of November 2018 to The Sounding Line.
Enjoy The Sounding Line? Click here to subscribe for free.
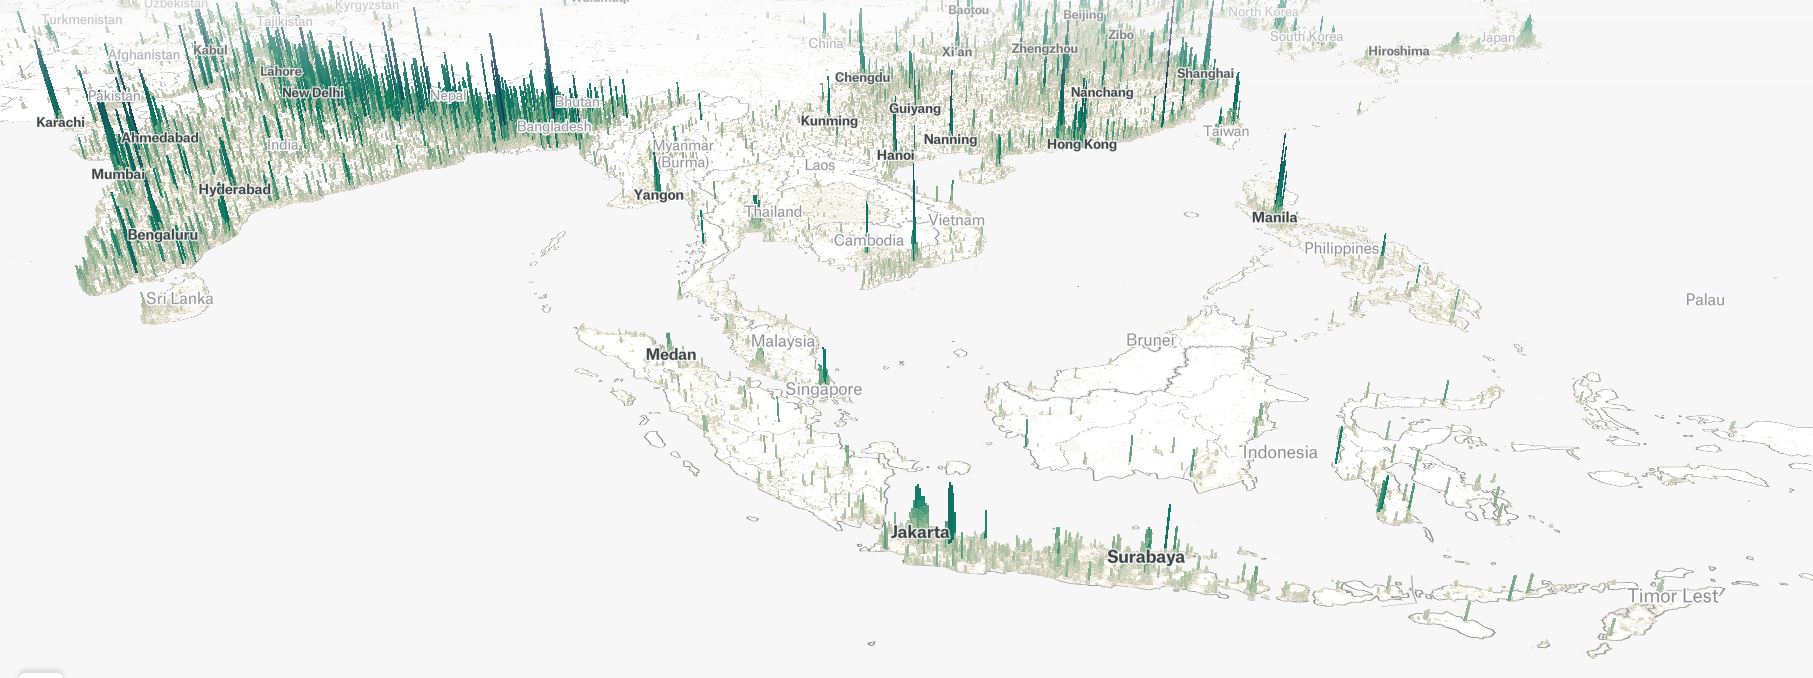
Today’s ‘Map of the Day’ comes from ThePudding and shows the population density of every part of the world in great detail. By toggling the options at the top of the map, you can view the population density for any region and see how it has changed since 1975. It is not possible to embed the map here, so follow this link or click on the image below to view the interactive map.
Beyond how remarkably disperse the population of the Americas is, what I found particularly interesting (when selecting the “Show Change 1990-2015” mode) is that not only have rural populations in many regions of the world decreased, so have the populations in the many smaller and medium sized regional cities. The trend is less pronounced in certain regions but particularly strong in East Asia and East Europe where seemingly every city expect the capitals and major metropolises have seen population declines. Not only is the world urbanizing, it seems to be shifting to the very biggest cities.
P.S. If you would like to be updated via email when we post a new article, please click here. It’s free and we won’t send any promotional materials.
Would you like to be notified when we publish a new article on The Sounding Line? Click here to subscribe for free.


