Submitted by Taps Coogan on the 26th of February 2017 to The Sounding Line.
Enjoy The Sounding Line? Click here to subscribe for free.
In Part IV of our ongoing series on US international trade (Part I, Part II, Part III), we examine ‘free-trade’ and its effect on the US trade deficit.
Free trade has become a politically contentious subject and many feel that free trade has led to the offshoring of American industry and jobs. Therefore, we take a high level look at what effect, if any, reductions in tariffs and the establishment of formal free trade agreements have had on the US balance of trade.
This analysis will focus on the trade of goods. Data on the trade of services is not available for the required time periods for most of the countries in question. Given that the central concern regarding America’s trade relations is the loss of industry and manufacturing jobs, focusing on goods is appropriate.
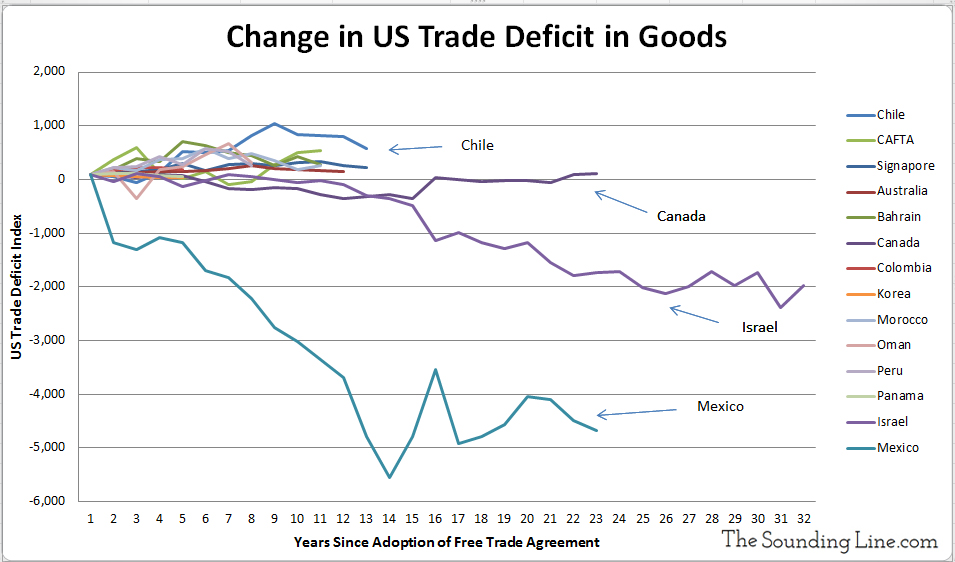
The US has established free trade agreements with 20 countries beginning in 1985 with Israel. Of those 20 countries, the US balance of trade in 2016 has improved with 16 countries compared to the year of implementation of the respective trade agreement. Only in four cases (Israel, Mexico, Nicaragua, and South Korea) was the US balance of trade in goods worse (a larger US trade deficit) in 2016 than the year of implementation.
The following chart sums up the change in the balance of trade with each free trade partner after a free trade agreement was implemented. The trade deficit or surplus with each country for the first year the trade agreement has been indexed to 100 regardless of whether it was a deficit or surplus. CAFTA refers to the Central American Free Trade Agreement and covers the Dominican Republic, Honduras, Costa Rica, El Salvador, Guatemala, and Nicaragua.

Of the US Free trade partners, only Mexico and Israel stand out as having dramatically worsened since the adoption of a free trade agreement. In the majority of cases, the US trade deficit (or surplus) has improved since the adoption of a free trade agreement. This is not to say that the US doesn’t have a problem with trade deficits with the free trade partners. It ran a $146 billion trade deficit with its free trade partners in 2016. However, only a few trading partners are responsible for the vast majority of the deficit, Mexico being the prime example.
As discussed in Part III of the series, the largest source of the $734 billion US trade deficit is China, which is not covered by a free trade agreement. The trade deficit with China is $347 billion or 47% of the total US deficit in 2016. After China comes the EU with a deficit of $147 billion and Japan with a deficit of $69 billion. These three combined, with whom the US does not have a free trade agreement, account for over 76% of the US trade deficit in goods in 2016, and that percentage has been climbing in recent years.

The take away from these charts is that America’s trade deficit is primarily and increasingly a result of trade with China, the EU, and Japan, countries not covered by free trade agreements. While the US also has a trade deficit with its free trade partners, though is a fraction of the overall deficit.
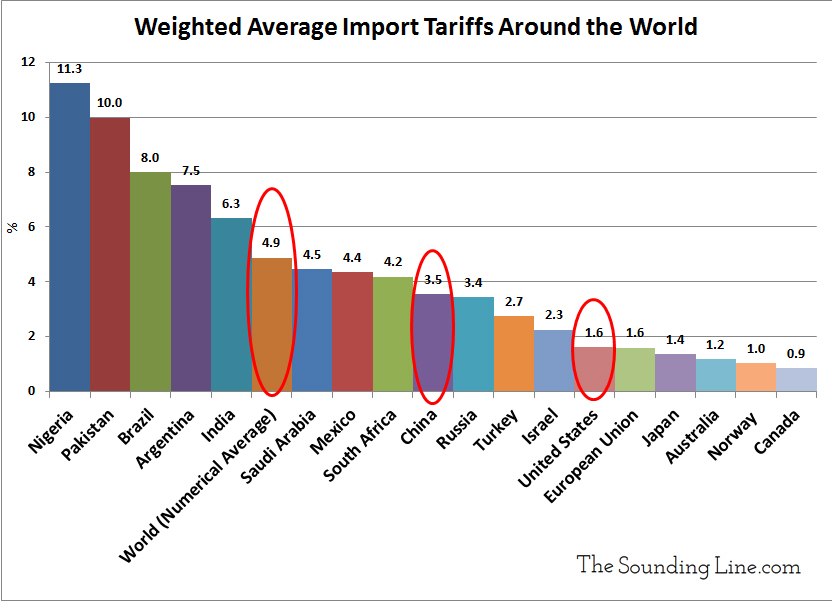
To the extent that tariffs affect trade deficits, it is not the level of tariffs that drive trade imbalances. It is differences between the tariffs of two countries that drive trade imbalances. Free trade agreements that bring tariffs down to equal levels should not exacerbate trade deficits; they increase the volume of trade in both directions. It is when two countries have different tariffs that trade imbalances are exacerbated. As the following chart shows, the average US import tariff on goods is significantly lower than the world average, as well as the tariffs of China. For this reason alone, it should come as little surprise that the US maintains a trade deficit with the rest of the world. Not only is the cost of production lower in most other countries, the tariffs are also higher.

As discussed in Part I of the series, trade deficits should be naturally correcting. Tariffs and the relative US cost of production have varied widely through American history (here) and despite several fold changes, the US managed to maintain balanced trade for the first 200 years of the country’s history. Only since foreign purchases of trillions of dollars of US federal debt and trillions more of US dollars starting in the early 1980s has the US been able to grow such a large and sustained trade deficit. The exporting of federal debt and US currency has offset the export of US made goods. It is no coincidence that China, the EU, and Japan are the largest foreign holders of US debt (here). If the US is serious about balancing its trade deficit, its first and foremost objective should be to reduce the federal debt. It must also carefully examine trade relations with those countries responsible for the largest deficits: China, the EU, Japan, and Mexico. In cases where trade partners apply higher tariffs on US goods than vice versa (China), tariffs should be matched, but the desire to keep tariffs low should be maintained.
P.S. We recently added email distribution for The Sounding Line. If you would like to be updated via email when we post a new article, please click here. It’s free and we won’t send any promotional materials.
Would you like to be notified when we publish a new article on The Sounding Line? Click here to subscribe for free.

