Taps Coogan – April 20th, 2021
Enjoy The Sounding Line? Click here to subscribe for free.
Enjoy The Sounding Line? Click here to subscribe.
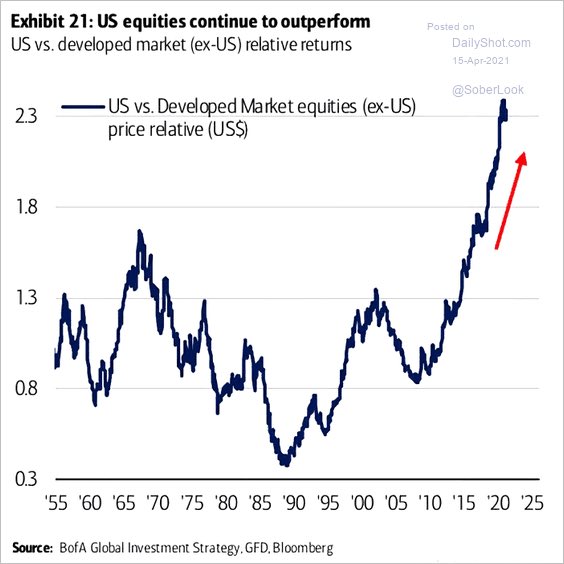
US equity outperformance has been so consistent over the last decade that it is easy to forget just how historically anomalous it is, as the following chart from BofA via the DailyShot.com shows.

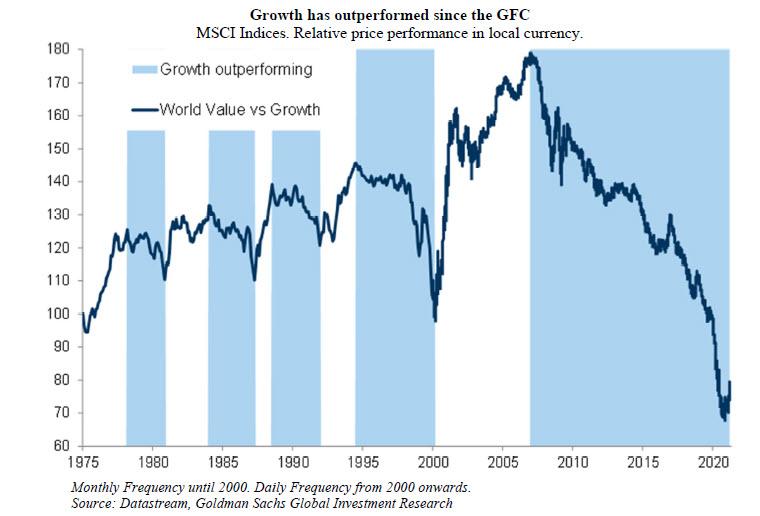
From 1955 through 2009, US equity performance relative to non-US markets oscillated around ‘1’ in the chart above, in other words rough parity in performance with large swings in both directions. That dynamic apparently changed after the Global Financial Crisis as the US dominance in fast growing tech sectors dovetailed with the growth oriented market trend since then.
All of which begs the question, if the ‘Growth’ super-trend since 2009 really is peaking as many now assert, is US equity outperformance headed for a mean reversion too?

Would you like to be notified when we publish a new article on The Sounding Line? Click here to subscribe for free. Also, please consider sharing this article so that we can grow The Sounding Line!
Would you like to be notified when we publish a new article on The Sounding Line? Click here to subscribe for free.

