Taps Coogan – July 1st, 2021
Enjoy The Sounding Line? Click here to subscribe for free.
Enjoy The Sounding Line? Click here to subscribe.
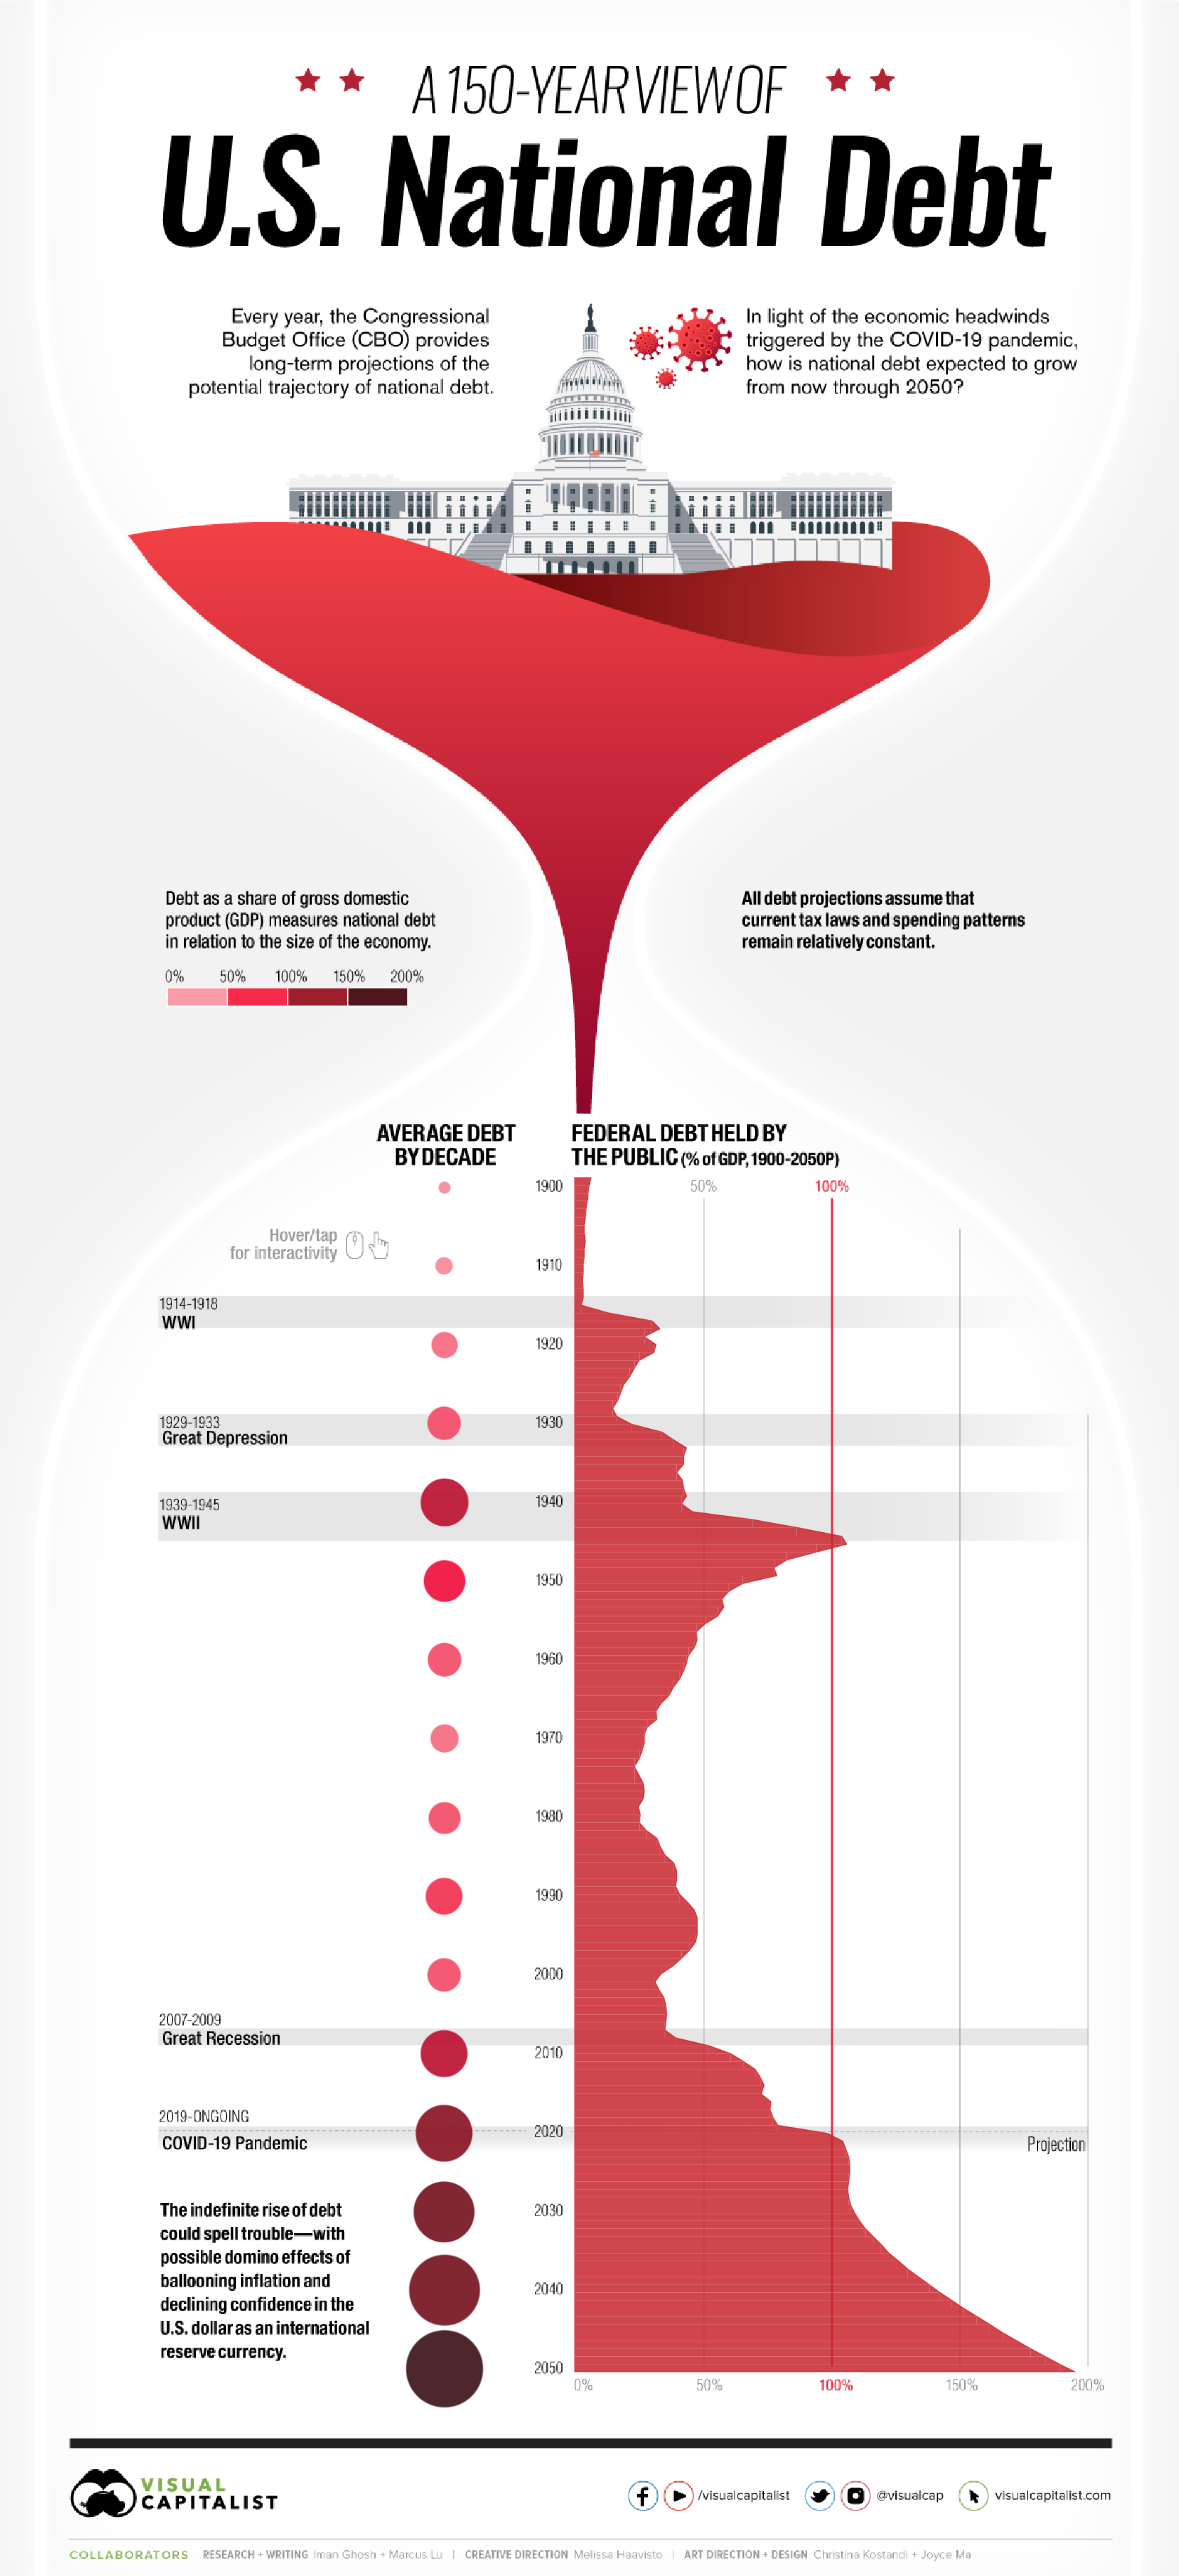
The following infographic, from Visual Capitalist, shows the US national debt held by the public since 1900 with a projection until 2050. It is important to note that it excludes intra-governmental debt, such as the debt held by the Social Security Trust. That intra-governmental debt adds another roughly 25% of debt-to-GDP and represents unfunded liabilities owed benefit receivers.

As Visual Capitalist notes:
“Recent increases to the debt have been fueled by massive fiscal stimulus bills like the CARES Act ($2.2 trillion in March 2020), the Consolidated Appropriations Act ($2.3 trillion in December 2020), and most recently, the American Rescue Plan ($1.9 trillion in March 2021).”
Each of those bills would have individually been the most expensive stimulus bill in history.
As the graphic highlights, the CBO forecasts the national debt hitting 200% of GDP by 2050 as the interest on the national debt goes exponential in the coming years. The CBO has consistently underestimated the pace of growth in the national debt over the decades.
Would you like to be notified when we publish a new article on The Sounding Line? Click here to subscribe for free.
Would you like to be notified when we publish a new article on The Sounding Line? Click here to subscribe for free.

