Taps Coogan – January 3rd, 2022
Enjoy The Sounding Line? Click here to subscribe for free.
Enjoy The Sounding Line? Click here to subscribe for free.
Imagine living in a world with rapid technological advances in nearly every domain from medicine and space exploration to information systems and communications. Imagine that such technology revolutions had spawned a new generation of rapidly growing companies that had become the largest companies in the world in just one or two decades and enabled massive increases in personal productivity.
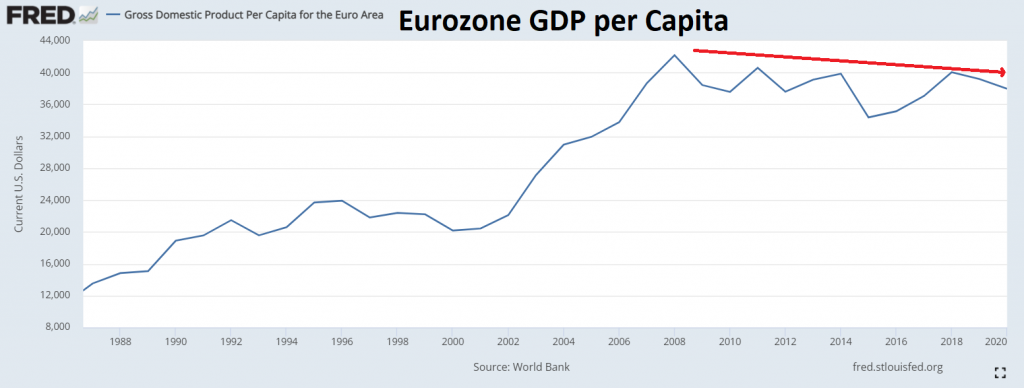
Imagine being a large union of well capitalized countries in that world and failing to generate one such new large company in decades and seeing your GDP per capita drop 10% since 2008, a time during which GDP per capita has increased 15% in Switzerland, 30% in the US, roughly 50% in South Korea and Singapore, and doubled in Taiwan.
Eurozone GDP per Capita

Something is broken in the Eurozone and it probably has something to due with policy makers’ deep skepticism, if not outright resentment, of private economic initiative and free market forces. Of course there is virtually no chance of that changing, so one aught to expect this trend to remain in place.
Would you like to be notified when we publish a new article on The Sounding Line? Click here to subscribe for free.
Would you like to be notified when we publish a new article on The Sounding Line? Click here to subscribe for free.


The graph measures GDP per capita in current US$. The Euro has depreciated against the dollar since 2008 (which happened to be its peak value) — 1.6 per US$ to 1.13 today.
Here is GDP per capita for the EU (couldn’t find one for the Eurozone) in international $, which measures purchasing power vs the dollar:
GDP per capita, PPP (current international $) – European Union | Data (worldbank.org)
Lies, damned lies, and statistics (and graphs).
Using Real GDP per capita for the Eurozone in EUROS reveals a similar result, albeit slightly less strong: zero growth since 2008. Regardless, if I use local currency real GDP per capita for each country I will arrive at the same result: zilch in the Eurozone, more in Switzerland, even more in the US, yet more in Korea, Singapore Taiwan, China, etc…. https://fred.stlouisfed.org/graph/?g=KuLu The Eurozone is not the European Union and you will almost never see me reference PPP adjusted GDP figures as I consider it basically a logical fallacy where a country’s income is adjusted up almost as a… Read more »