Taps Coogan – January 24th, 2022
Enjoy The Sounding Line? Click here to subscribe for free.
Enjoy The Sounding Line? Click here to subscribe for free.
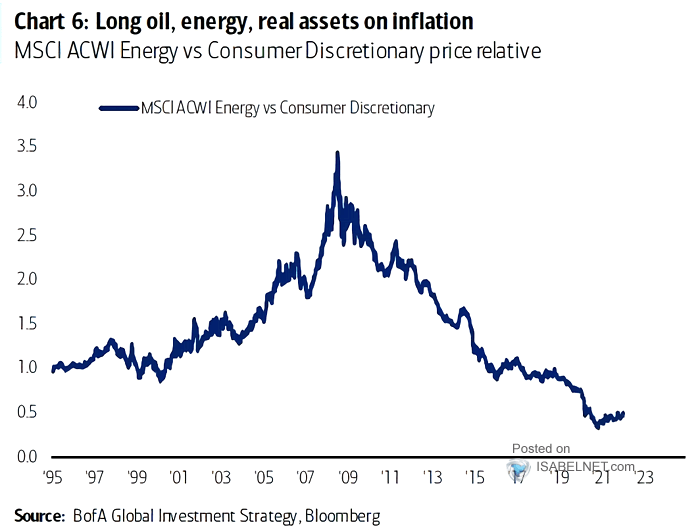
The following chart, from Bank of America via ISABELNET, shows how global energy stocks have underperformed consumer discretionary stocks since the Global Financial Crisis.

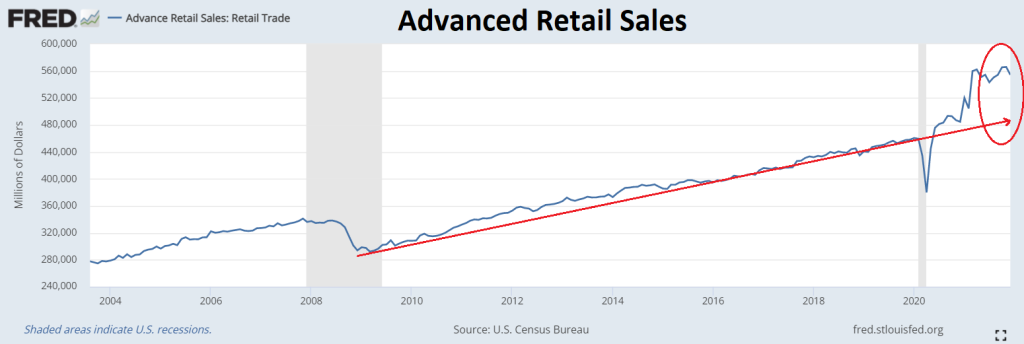
As the chart below highlights, a return to the pre-Covid growth trend in retail sales would amount to a roughly $50 billion decline in sales. While such a decline would presumably be moderated by inflation – at least nominally, it represents a larger drop than the peak to trough decline in retail sales during the Global Financial Crisis (~$49 billion).

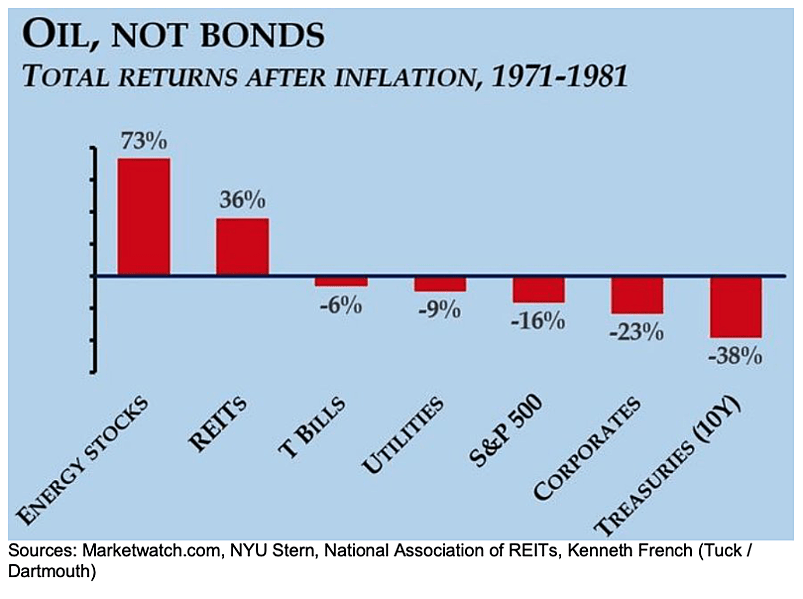
Speaking of inflation, energy was the best trade in the 1970s.

Speaking of energy, as Bloomberg recently noted:
“In the past year, though, prices for solar panels have surged more than 50%. Wind turbines are up 13%, and battery prices are rising for the first time ever.”
80% of the world’s solar panels are made in China, a country in which about 68% of total energy consumption comes from coal.
Would you like to be notified when we publish a new article on The Sounding Line? Click here to subscribe for free.
Would you like to be notified when we publish a new article on The Sounding Line? Click here to subscribe for free.

