Taps Coogan – March 20th, 2022
Enjoy The Sounding Line? Click here to subscribe for free.
Enjoy The Sounding Line? Click here to subscribe for free.
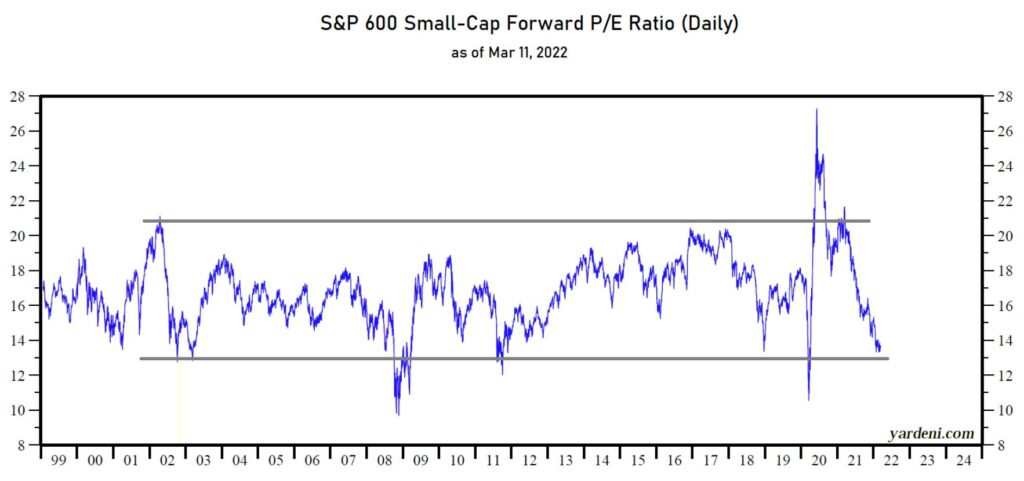
The following chart, from Yardeni Research via Alpha Charts, shows the forward P/E for the S&P 600 Small Cap index. Despite all the bubble talk, this is one of the ‘cheapest’ readings for US small cap stocks in over 20 years.

Notably, the forward P/E is based on earnings forecasts which remain quite strong despite multiple headwinds that may see them weaken. Nonetheless, the standard P/E is only 14.14 at the time of writing, hardly an ‘expensive’ reading either.
Whereas the bubble in stocks in late 2020 and last year is clear in the chart above, the landscape has shifted as the S&P 600 index has traded net-flat over the last 12 months while earnings rose strongly. What a difference a year can make.
Of course, P/E and forward P/E ratios have never been good leading indicators for market corrections. Many bear markets have started with low P/Es and then seen ratios rise as stocks went down faster than earnings, e.g. 2001-2002.
Would you like to be notified when we publish a new article on The Sounding Line? Click here to subscribe for free.
Would you like to be notified when we publish a new article on The Sounding Line? Click here to subscribe for free.


I wonder how they calculate it, if they drop companies with zero or negative earnings. Birinyi has the current Russell 2000 P/E at 65 and the forward at 23.