Taps Coogan – August 7th, 2022
Enjoy The Sounding Line? Click here to subscribe for free.
Enjoy The Sounding Line? Click here to subscribe for free.
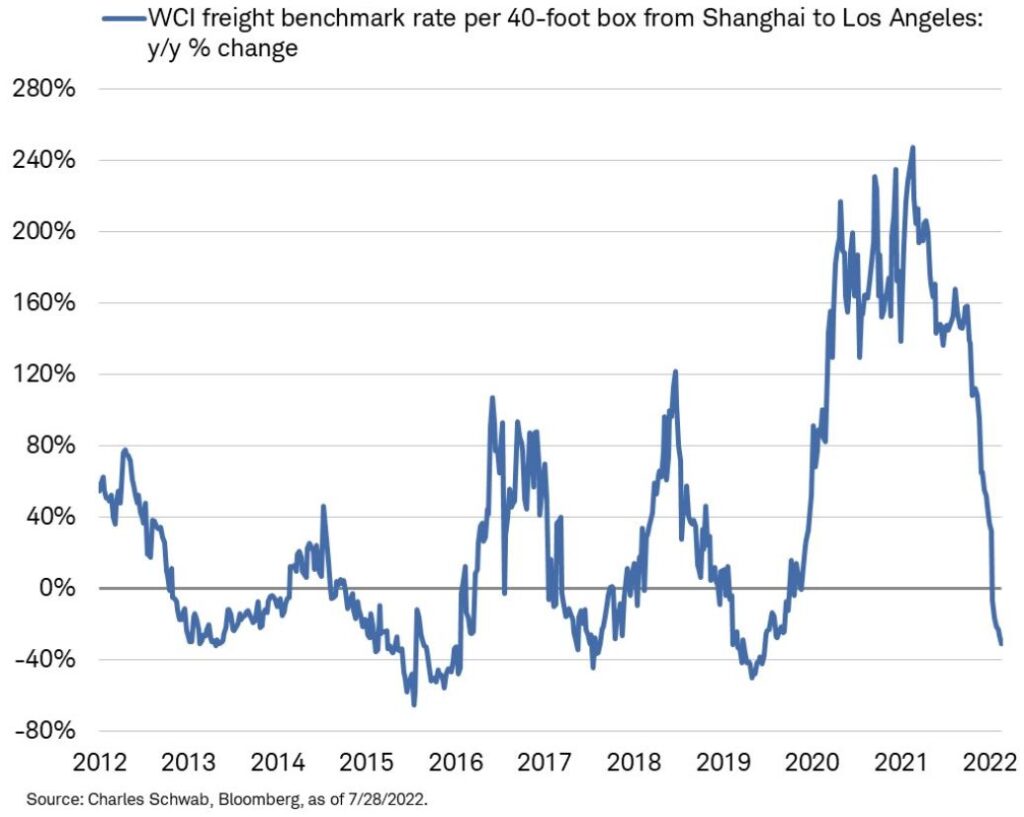
The following chart, from Charles Schawb’s Liz Ann Sonders, shows the year-over-year rate of change in benchmark Shanghai to LA container shipping costs.

The chart pretty much speaks for itself. One of the major drivers of our endless supply chain bottlenecks, the shortage of East-West container shipping relative to demand, has essentially resolved itself.
Along with dropping commodity prices, slowing economic activity, and falling rates, it seems likely that the year-over-year peak in inflation is in the books.
Would you like to be notified when we publish a new article on The Sounding Line? Click here to subscribe for free.
Would you like to be notified when we publish a new article on The Sounding Line? Click here to subscribe for free.


that is the biggest bunch of BS I have ever seen. We are still paying way over the baseline of 2019.
Prices are never getting back to 2019 levels just like in 2019 they were never getting back to 2015 levels. Prices go up in a fiat system. The crisis part was when they were going up 240% and that’s over.