Taps Coogan – January 19th, 2023
Enjoy The Sounding Line? Click here to subscribe for free.
Enjoy The Sounding Line? Click here to subscribe for free.
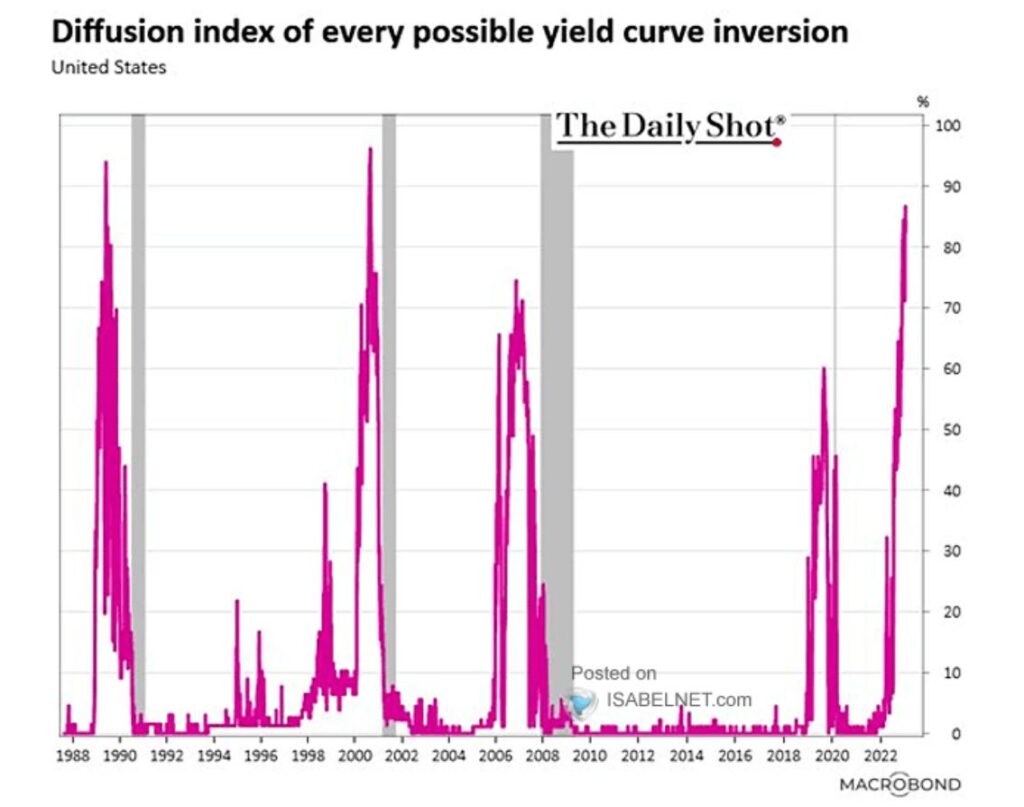
The following chart, from Macrobond via Isabelnet, shows that the Treasury yield curve is continuing to invert, with nearly 90% of possible inversions now complete.

There are two punchlines from this chart.
The first, already widely known, is that the yield curve is severely inverted. Yield curve inversions have proceeded every recession since World War II and the 10-year-3-month inversion has only given one false positive in 1968. While no leading recession indicator is perfect, yield curve inversions are considered the gold standard. Most other leading indicators are also signaling recession, such as the Conference Board present vs expectations indexes, PMIs, etc…
The second point is that yield curve inversions typically reverse before a formal recession sets in, a process that can take a year after the peak inversion. This inversion has not yet begun to reverse, which means that the formal recession that everyone and their dog is predicting may take a while to kick in. Considering that we are already in a quasi-recession it’s unclear if that’s a good thing.
Would you like to be notified when we publish a new article on The Sounding Line? Click here to subscribe for free.

