Taps Coogan – February 22nd, 2022
Enjoy The Sounding Line? Click here to subscribe for free.
Enjoy The Sounding Line? Click here to subscribe for free.
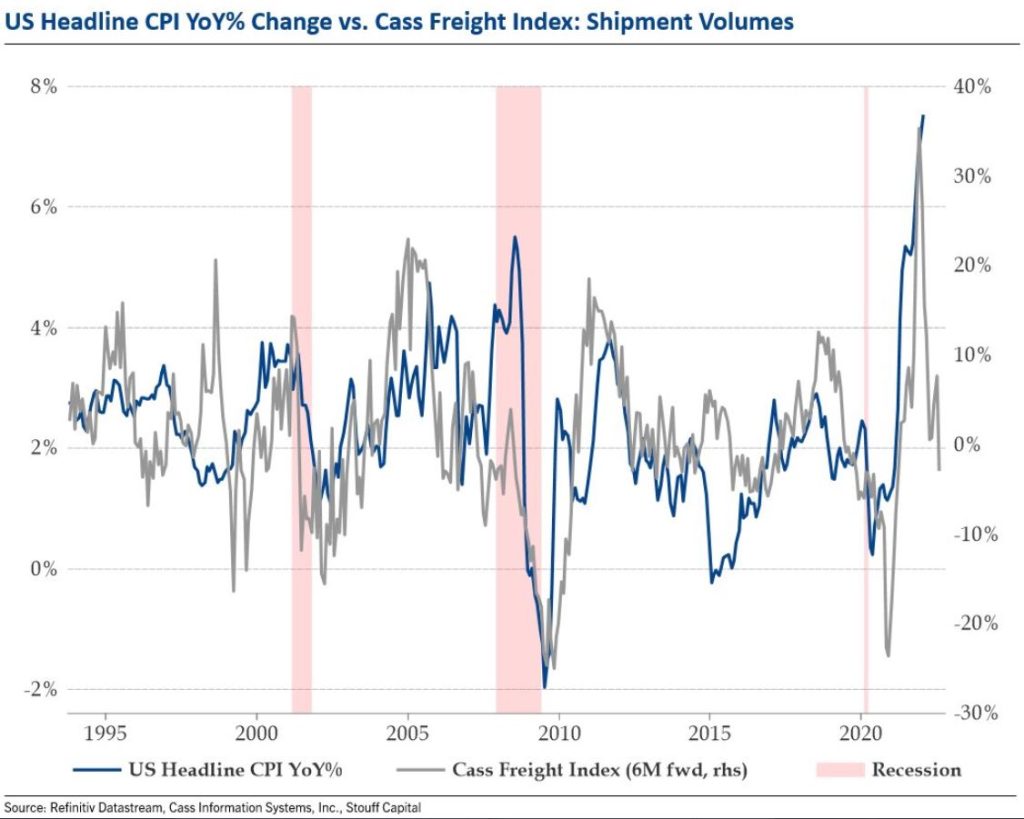
The following chart, from Stouff Capital via Julien Bittel, shows the correlation between the year-over-year changes in the Cass Freight Index and CPI.

As we noted for a very similar chart about Rebar prices and Chinese Producer Prices, the chart above includes forward prices for the Cass Index. Forward prices are not particularly predictive of actual future prices. They basically just take the current price and account for the carrying costs, and the risk free rate, but the point is that the Cass Index has to keep accelerating from last year’s already high readings to keep the year-over-year price growth rate high. That seems unlikely.
Add this to the growing list of indicators that inflation in probably peaking on a year-over-year basis. The Fed missed the entire window to tighten.
Would you like to be notified when we publish a new article on The Sounding Line? Click here to subscribe for free.
Would you like to be notified when we publish a new article on The Sounding Line? Click here to subscribe for free.

