Taps Coogan – March 29th, 2021
Enjoy The Sounding Line? Click here to subscribe for free.
Enjoy The Sounding Line? Click here to subscribe.
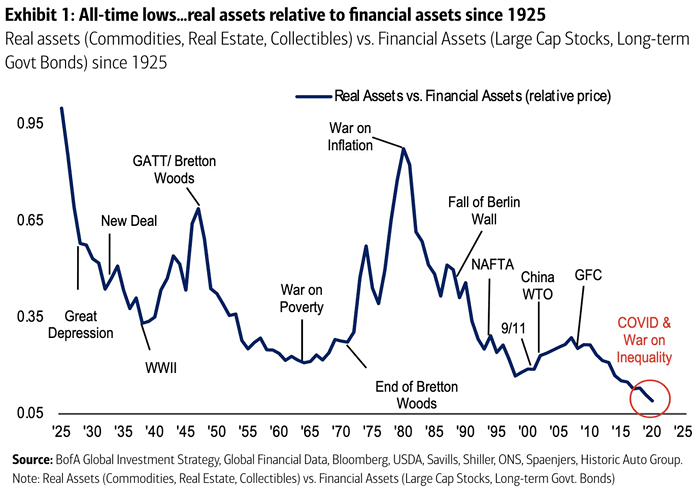
The following chart, from Bank of America via Isabeltnet, shows the ratio of ‘real’ assets (commodities, real-estate, collectibles) to ‘financial’ assets (large cap stocks and long term government bonds) since 1925.

Narrowly defined as it is, the ratio has reached its lowest level on record, exceeding the Dot-Com and 1960s lows.
It’s tough to draw too many clean conclusions from the chart except that it is yet another example of today’s valuation extremes. The last two bottomings, 1999 and the late 1960s, corresponded to the start of major commodity bull markets and upwards inflation pressure, albeit much more so in the 1960s example than in 1999.
Would you like to be notified when we publish a new article on The Sounding Line? Click here to subscribe for free. The Sounding Line is now ad free and 100% reader supported. Thank you to everyone who has donated.
Would you like to be notified when we publish a new article on The Sounding Line? Click here to subscribe for free.

