Taps Coogan – May 21st, 2022
Enjoy The Sounding Line? Click here to subscribe for free.
Enjoy The Sounding Line? Click here to subscribe for free.
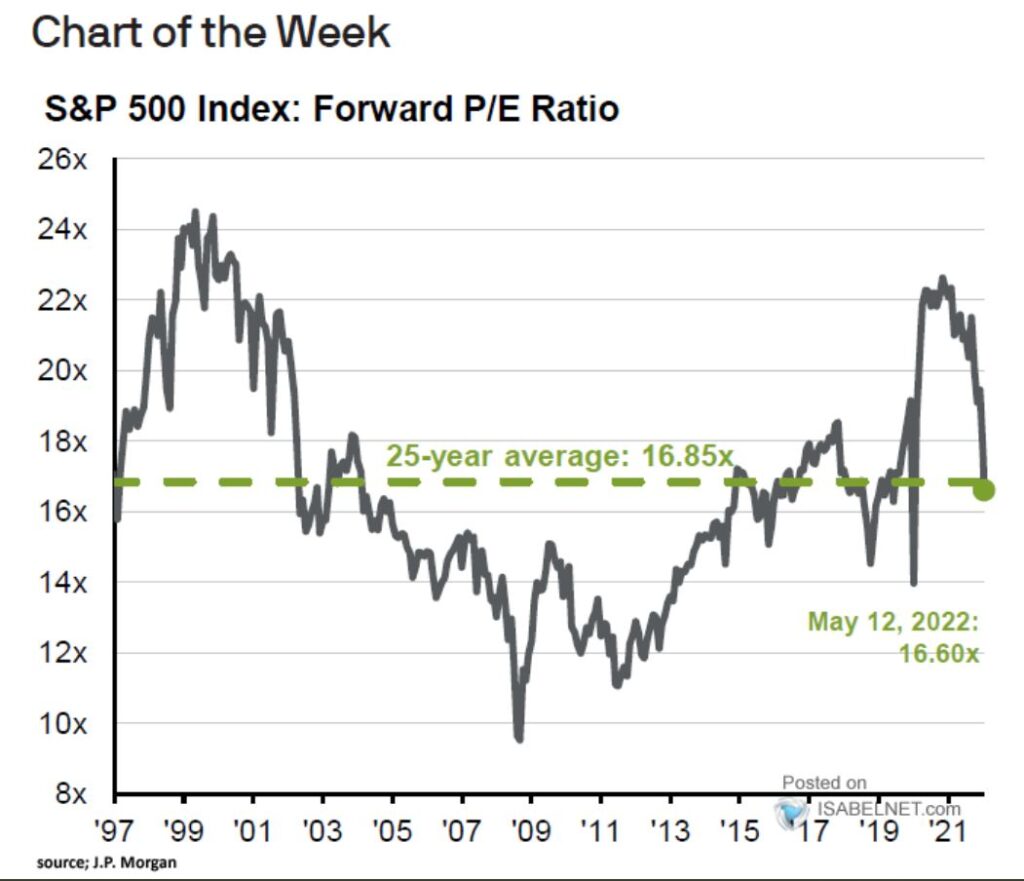
The following chart, via Isabelnet, shows the forward P/E (price to earnings ratio) of the S&P 500.

As of last week, the S&P 500 forward P/E had fallen back below its 25-year average: 16.85. That 25-year average contains the peaks of both the Dot-Com Bubble and last year’s Fed-Bubble, but nonetheless, valuations have become considerably more reasonable over the last six months and even more so in the week since this chart was created.
Of course, after overshooting by so much in 2020 and 2022, it wouldn’t be unusual for P/Es to now substantially undershoot the average.
Would you like to be notified when we publish a new article on The Sounding Line? Click here to subscribe for free.
Would you like to be notified when we publish a new article on The Sounding Line? Click here to subscribe for free.

