Submitted by Taps Coogan on the 3rd of January 2020 to The Sounding Line.
Enjoy The Sounding Line? Click here to subscribe for free.
Enjoy The Sounding Line? Click here to subscribe.
This article is the third part in a series exploring oil and gas production in the seven major US shale basins. To read about the Anadarko and Appalachia Basins, click here and here.
Today, we will discuss a collection of charts that detail oil and gas production, the number of drilling rigs and wells completed, and a few measures of productivity in the Bakken Basin. All of the charts are based on the most recent data from the US Energy Information Agency.
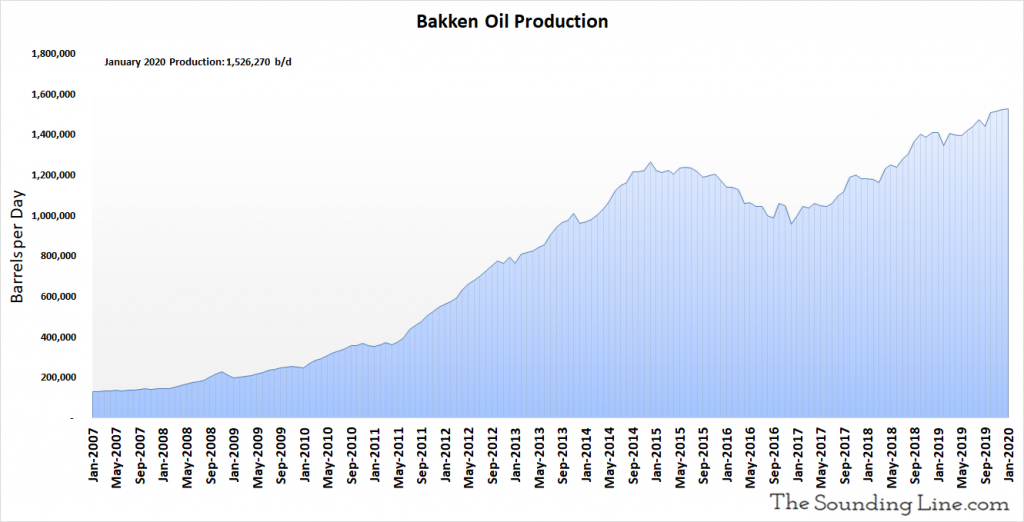
Bakken Oil Production
The Bakken basin is the second largest shale oil producing region in the US after the Permian basin. Oil production in the Bakken hit an all-time record high of slightly more than 1.526 million barrels per day (b/d) in January 2020.
Legacy Oil Production
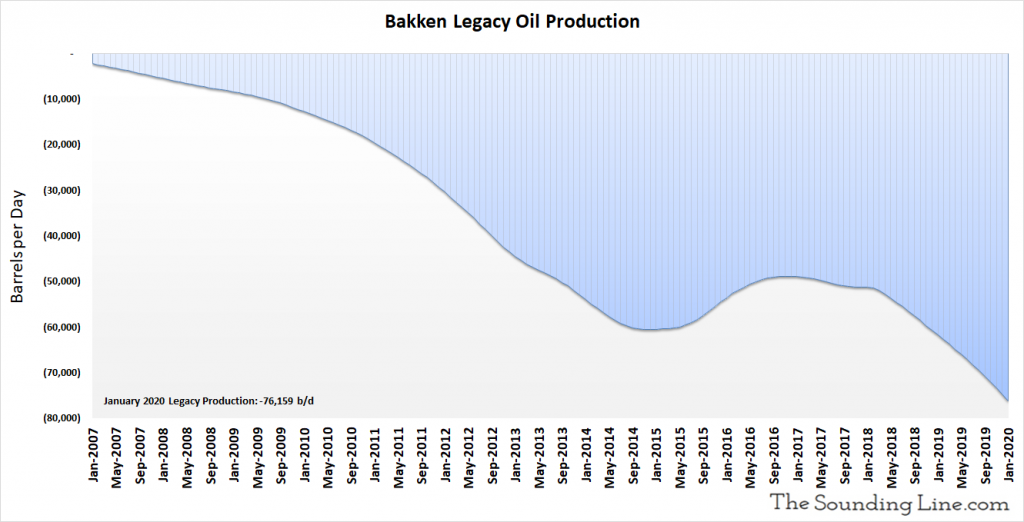
The following chart shows the monthly change in oil production from wells drilled in prior months. In other words, it shows the production decline rate of wells older than a month. That decline rate reached a record 76,159 b/d in January 2020. After plateauing from 2016 to 2018, legacy production declines have been accelerating.
Rig Count
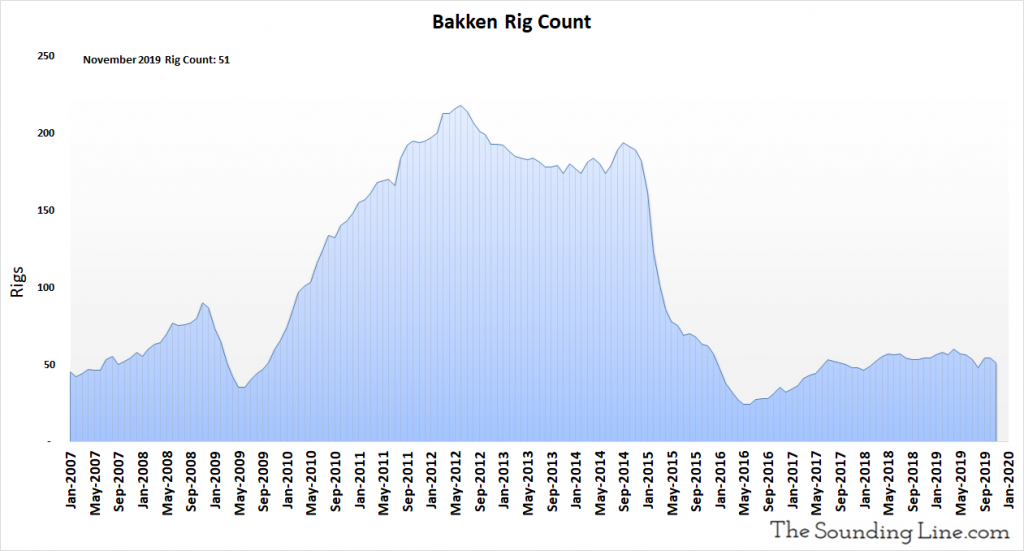
In November 2019, the most recent date for which data is available, there was estimated to be 51 rigs drilling new wells in the Bakken basin. The rig count has been osculating in the 50s for the last two years, a low level activity compared to before the oil price collapse of 2015-2016.
DUC Well Count
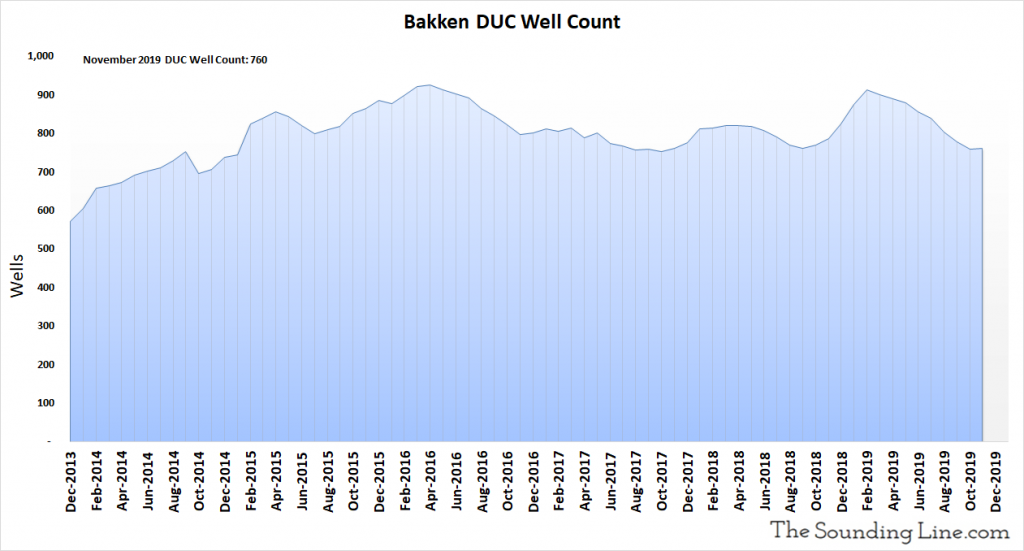
The DUC well count is the number of drilled but uncompleted wells in the Bakken basin. These represent an inventory of wells that have already been drilled by rigs but are not yet producing oil and gas. This inventory rose by two to reach 760 in November 2019, nearly the lowest level since at 2014.
Wells Drilled per Month
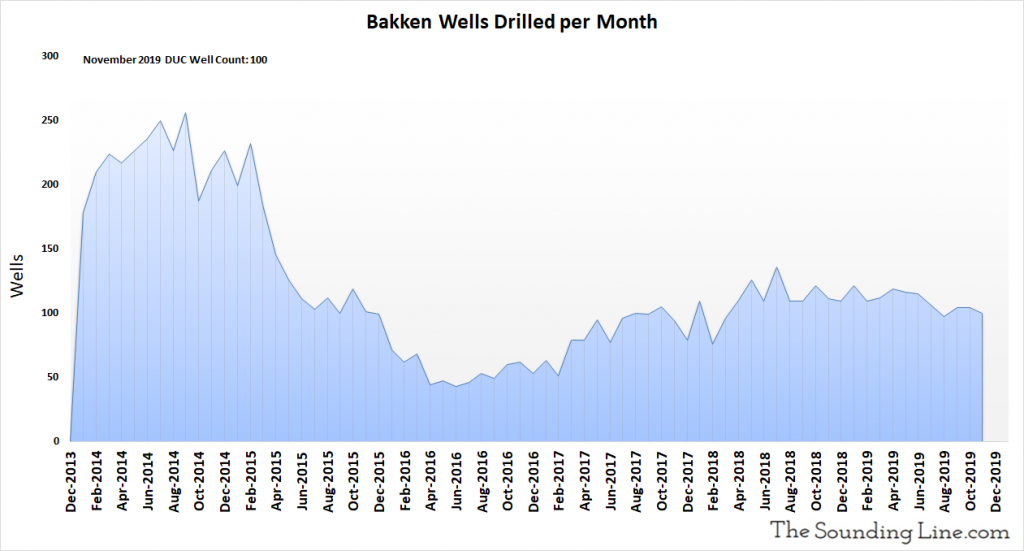
The following chart shows the number of new oil and gas wells drilled every month. 100 wells were drilled in November 2019, the second lowest number since March 2018.
Oil Production from Wells Completed Each Month
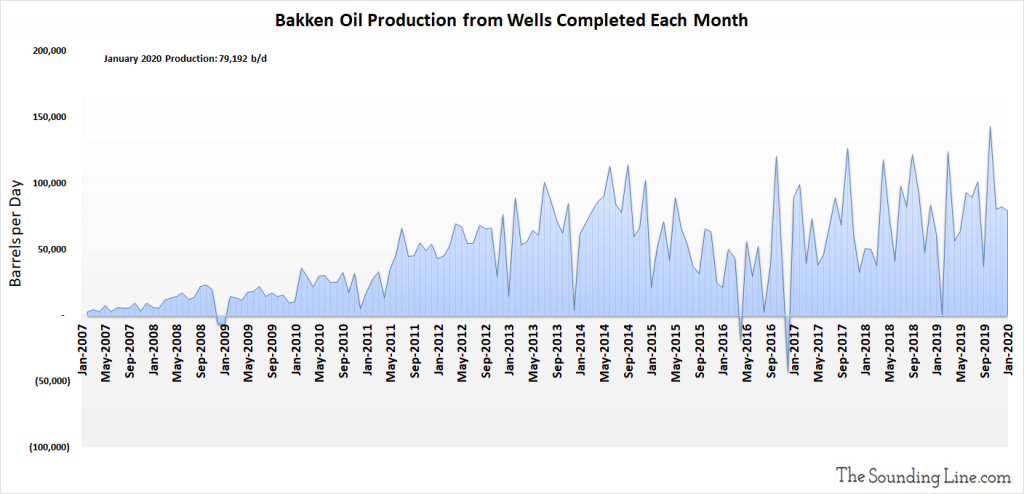
The following chart shows the oil production from just those wells that were completed in any given month. That may include wells that were previously DUC wells, but that were completed that month. Production from newly completely wells was 79,192 b/d as of January 2020, modestly above the average since 2014, albeit a decline compared to recent months. Production from newly completed wells increased until late 2014 and has been roughly range bound since then.
Oil Production from Wells Drilled and Completed Each Month, Excluding DUC Wells
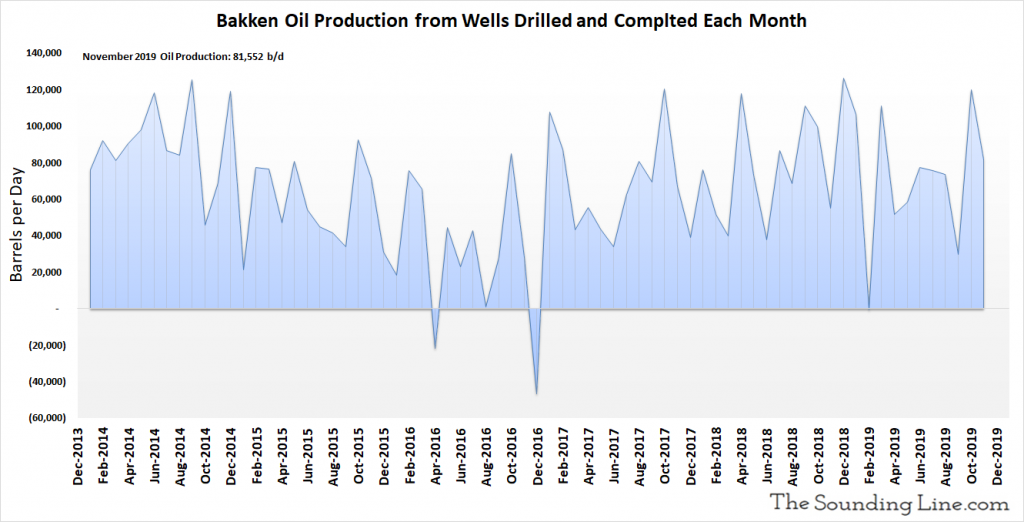
The following chart excludes production from DUC wells that were completed in a given month, and shows the production just from wells drilled and completed each month. It is an inferred number based on changes in production, legacy production, drilled wells, and completed wells. For months where the number of DUC wells increased, the implied production potential of those wells is included in the production figure even though that oil was not yet produced. Production from newly drilled and completed wells was 81,552 b/d as of November 2019, roughly average since 2014.
Oil Production per Well Completed Each Month
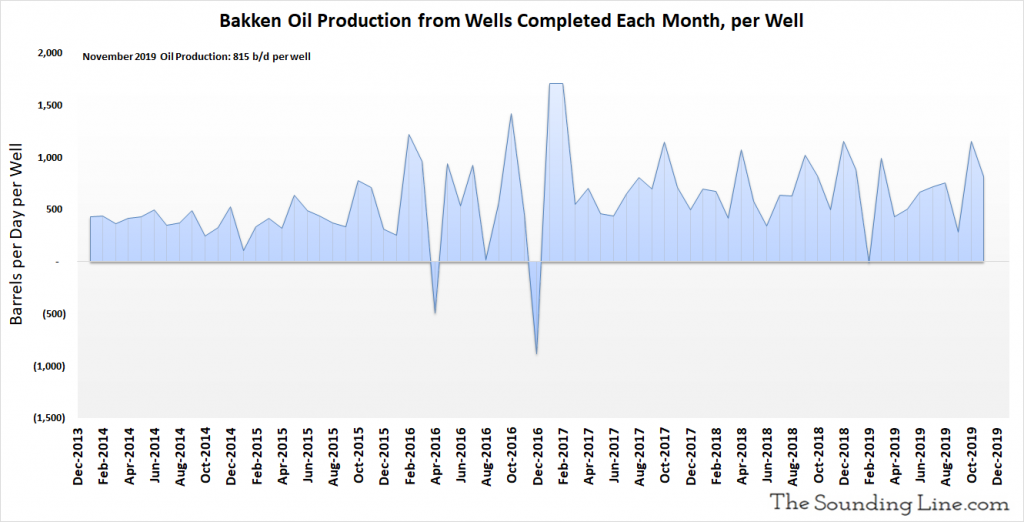
The following chart shows the oil production just from newly completed wells, per well, per month, including DUC wells that were completed. Production per completed well was 815 b/d as of November 2019, modestly above the average since 2014. There has been no clear trend of increasing production per new well since at least 2017.
Natural Gas Production
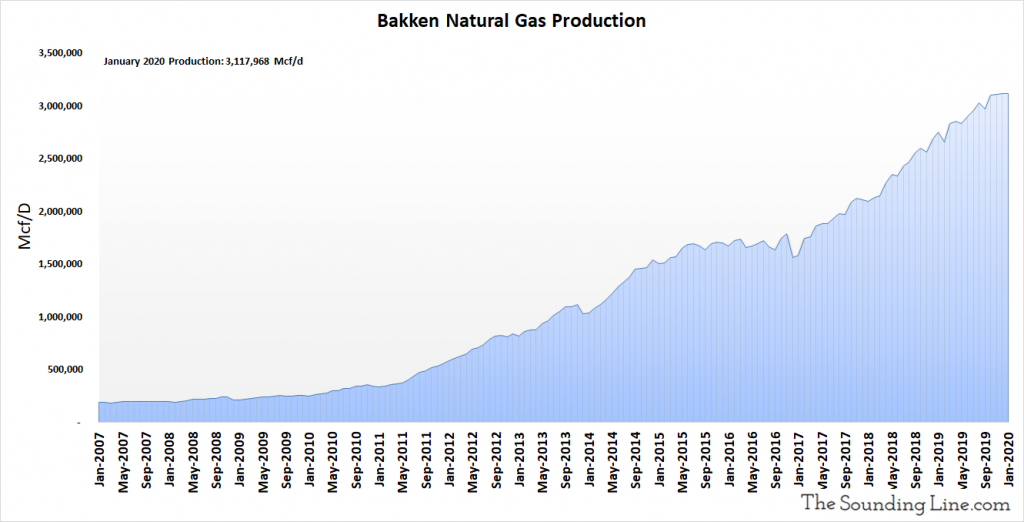
Natural gas production in January 2020 hit an all-time record high slightly above 3.1 million Mcf/d.
Legacy Natural Gas Production
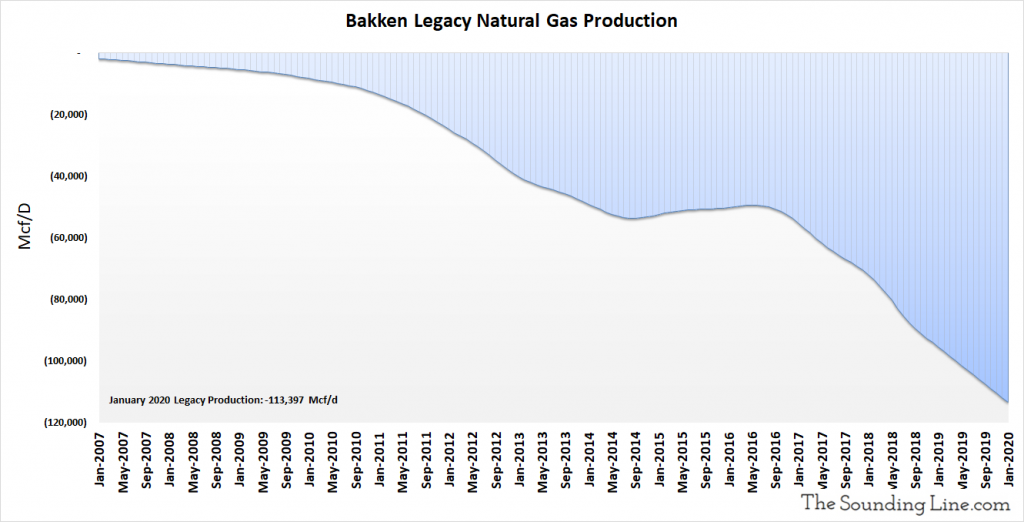
As with legacy oil production, the following chart shows the production decline rate of wells older than a month. That decline rate reached a record of over 113,387 Mcf/d in January 2020.
Gas Production from Wells Completed Each Month
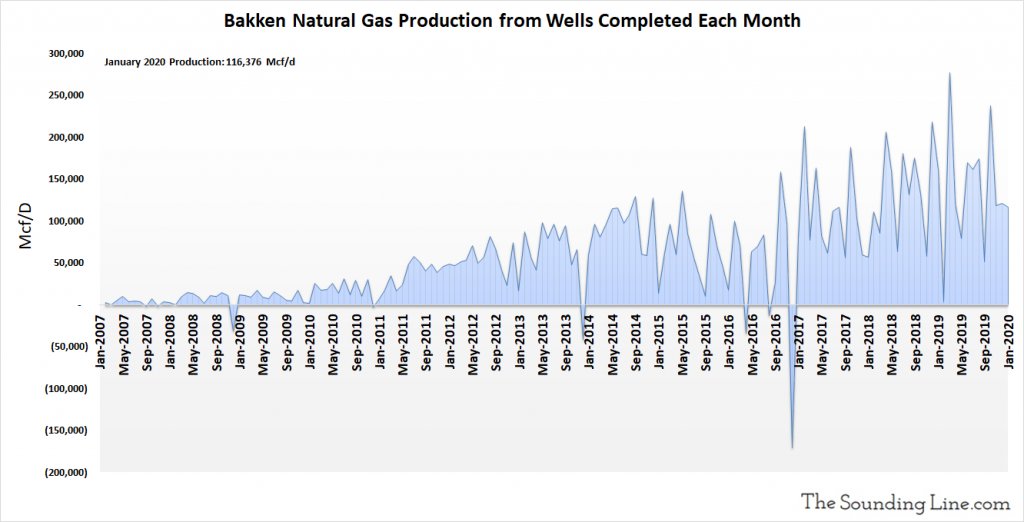
The following chart shows the natural gas production from just those wells that were completed in any given month. That may include wells that were previously DUC wells. Production from newly completely wells was 116,376 Mcf/d, as of November 2019. This metric continues to trend higher over time.
Gas Production from Wells Drilled and Completed Each Month, Excluding DUC Wells
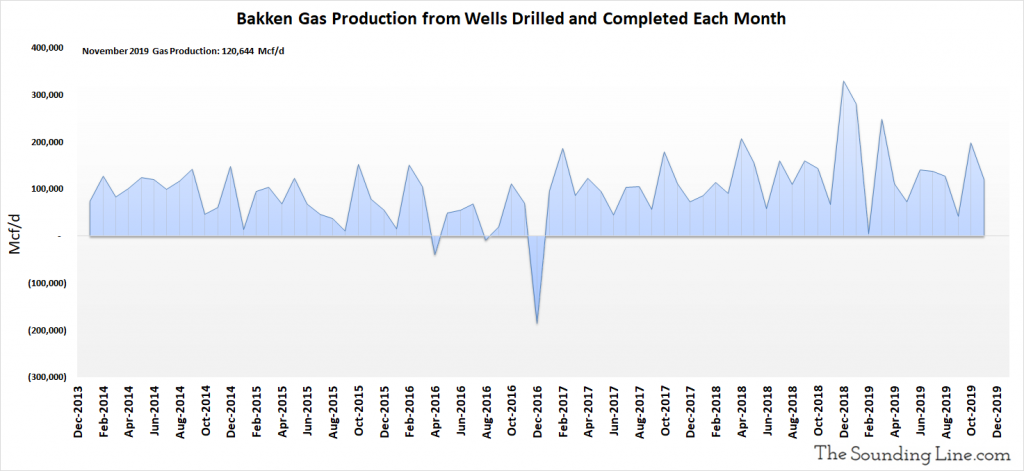
The following chart excludes production from DUC wells completed in a given month and shows the production just from wells drilled and completed each month. It is an inferred number based on changes in production, legacy production, drilled wells, and completed wells. For months where the number of DUC wells increased, the implied production potential of those wells is included in the production figure, even though that gas was not yet produced. Production from newly drilled and completed wells was 120,644 Mcf/d as of November 2019. This metric has shown no clear trend of increasing since at least 2014.
Some Thoughts
Oil production in the Bakken has continued to trend higher despite there being no clear trend of rising production from newly completed wells, despite low rig counts and low monthly drilling rates, and despite rising legacy production declines. As was the case with Anadarko and Appalachia, this appears to be the result of burning through the inventory of previously drilled ‘DUC wells.’ However, unlike in Appalachia and Anadarko, it will take many years to burn through the DUC well inventory at the current pace, during which time production could continue to rise.
Generally, the same dynamic is true for natural gas production. However, there has been a more perceptible rise in gas production from newly completely wells over the years. Nonetheless, the rise has reversed modestly during the last year and the increasing trend disappears entirely when accounting for completions of DUC wells. Yet again, this implies that gas production gains are largely a result of the pace of drilling and the usage of DUC wells, not any increasing productivity of newly drilled wells.
Unless the rig count rises significantly and the DUC well inventory is rebuilt, oil and gas production in the Bakken is on an unsustainable trajectory, though it could continue to grow from some considerable time.
We will discuss the remaining basins in the coming days and weeks.
Would you like to be notified when we publish a new article on The Sounding Line? Click here to subscribe for free.
Would you like to be notified when we publish a new article on The Sounding Line? Click here to subscribe for free.

