Submitted by Taps Coogan on the 5th of January 2020 to The Sounding Line.
Enjoy The Sounding Line? Click here to subscribe for free.
Enjoy The Sounding Line? Click here to subscribe.
This article is the fourth part in a series exploring oil and gas production in the seven major US shale basins. To read about the Anadarko, Appalachia, and Bakken basins, click here, here, and here.
Today, we will discuss a collection of charts that detail oil and gas production, the number of drilling rigs and wells completed, and a few measures of productivity in the Eagle Ford basin. All of the charts are based on the most recent data from the US Energy Information Agency.
Eagle Ford Oil Production
The Eagle Ford basin is the third largest shale oil producing region in the US after the Permian and Bakken basins. Oil production in the Eagle Ford basin was slightly more than 1.35 million barrels per day (b/d) in January 2020, a continuation of a modest decline since mid 2019 and well below the all-time high of over 1.7 million b/d in March 2015.

Legacy Oil Production
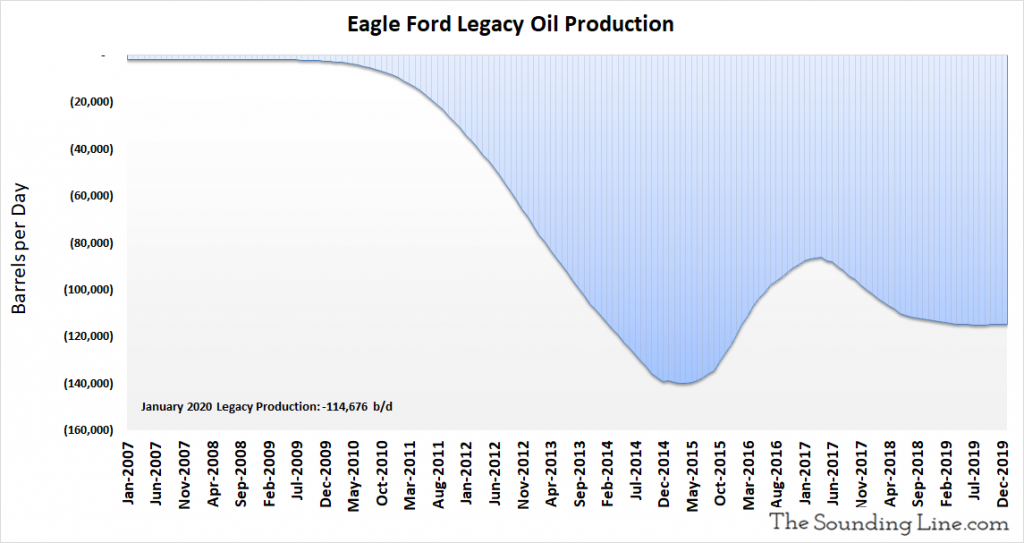
The following chart shows shows the production decline rate of wells older than a month. That decline rate was 114,676 barrels per day and has been holding steady since mid 2018. Legacy oil production declines peaked with overall oil production in early 2015.
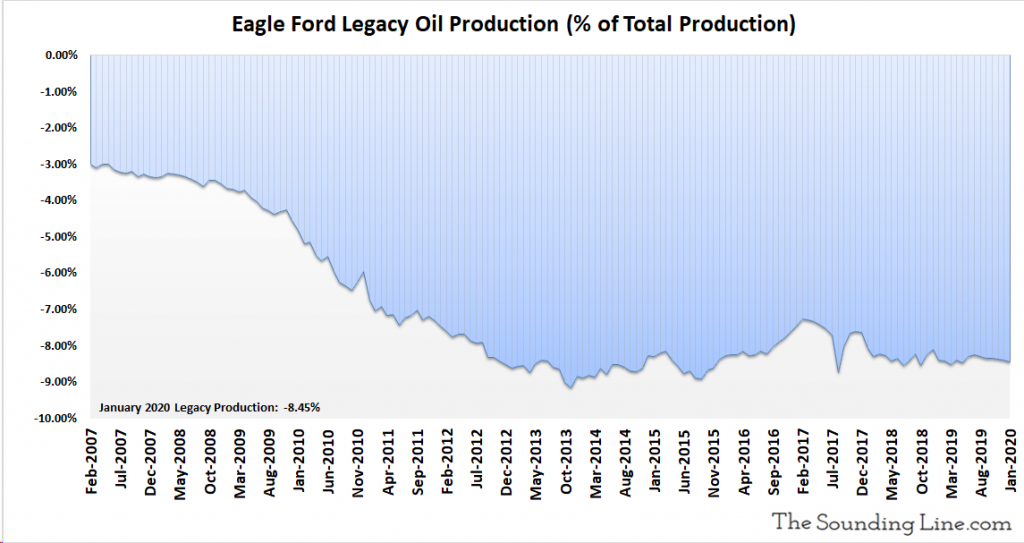
As a percent of total production, legacy oil production declines have been roughly constant since 2013.
Rig Count
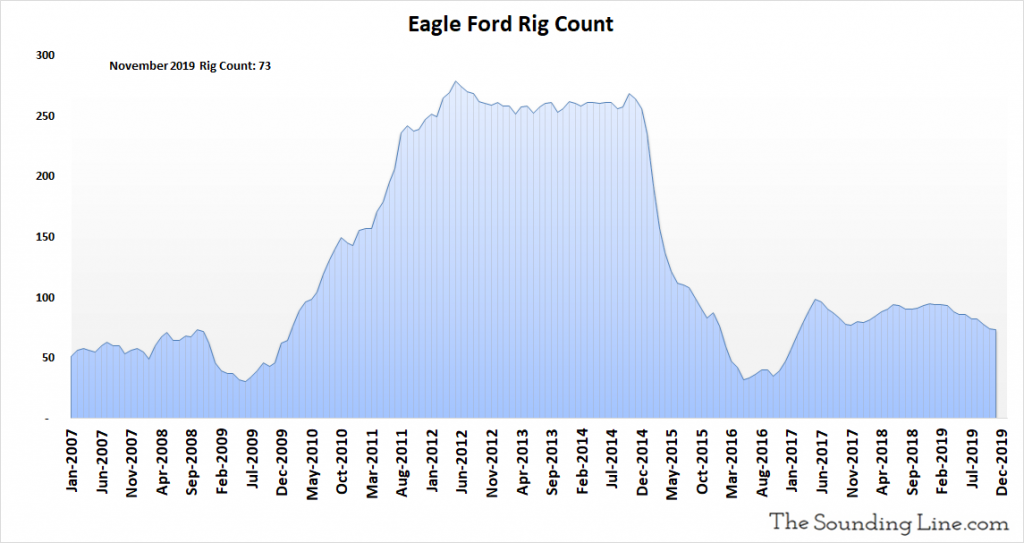
In November 2019, the most recent date for which data is available, there was estimated to be 73 rigs drilling new wells in the Eagle Ford basin. The rig count has been declining since early 2019 and remains far below the levels predating the oil price collapse in 2014.
DUC Well Count
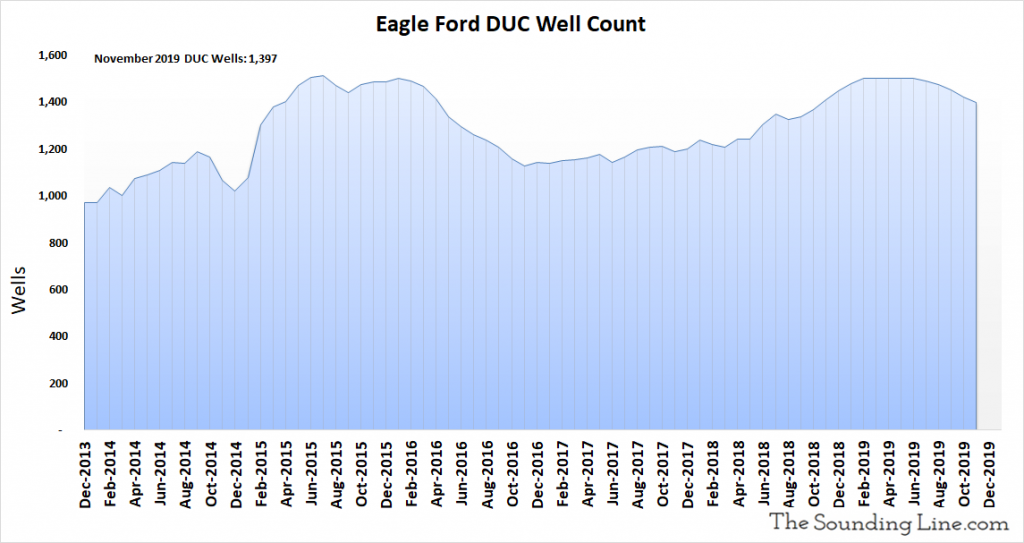
The DUC well count is the number of drilled but uncompleted wells in the Eagle Ford basin. These represent an inventory of wells that have already been drilled by rigs but are not yet producing oil and gas. This inventory fell to 1,397 wells in November 2019 and, while still relatively high, has been declining since early 2019.
Wells Drilled per Month
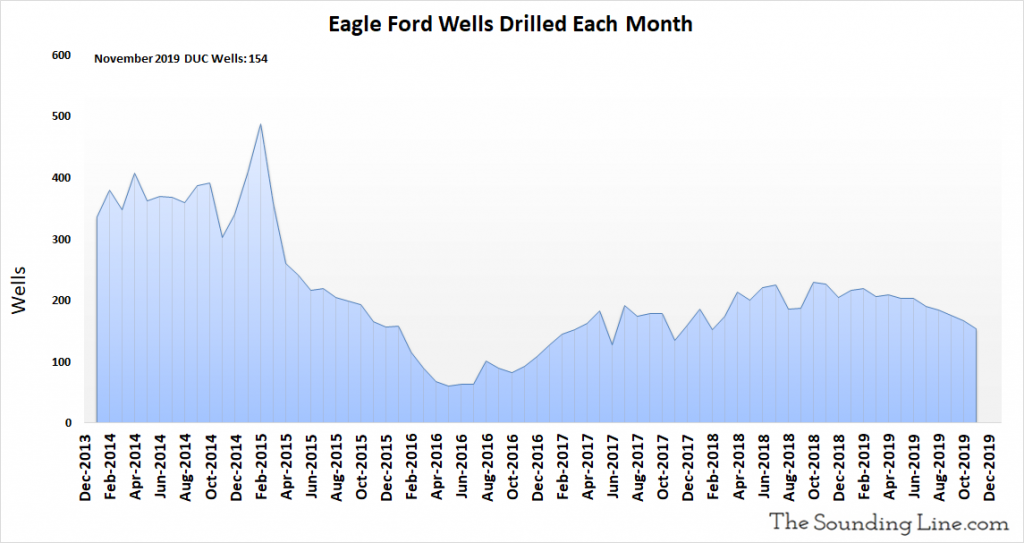
The following chart shows the number of new oil and gas wells drilled every month. 154 wells were drilled in November 2019. This number has been declining since late 2018, though it is still higher than when oil prices hit their lows in early 2016.
Oil Production from Wells Completed Each Month
The following chart shows the oil production from just those wells that were completed in any given month. That may include wells that were previously DUC wells, but that were completed that month. Production from newly completely wells was 105,780 b/d as of January 2020. Oil production from newly completed wells has not shown a clear upward trend since early 2015.

Oil Production from Wells Drilled and Completed Each Month, Excluding DUC Wells
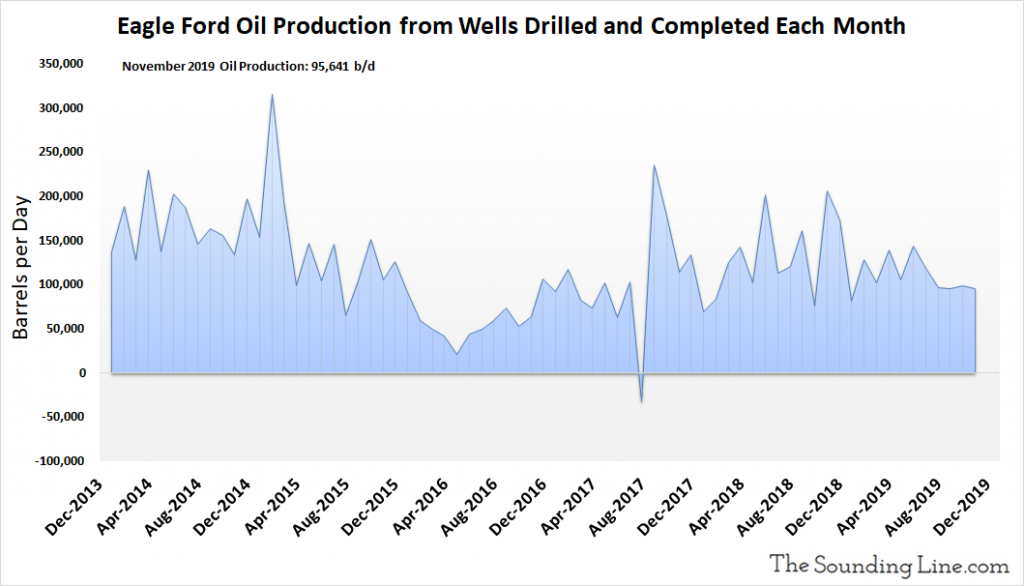
The following chart excludes production from DUC wells that were completed in a given month and shows the production just from wells drilled and completed each month. It is an inferred number based on changes in production, legacy production, drilled wells, and completed wells. For months where the number of DUC wells increased, the implied production potential of those wells is included in the production figure even though that oil was not yet produced. Production from newly drilled and completed wells was 95,641 b/d as of November 2019. There has been a slight trend of declining production from newly drilled and completed wells since late 2017.
Oil Production per Well Completed Each Month
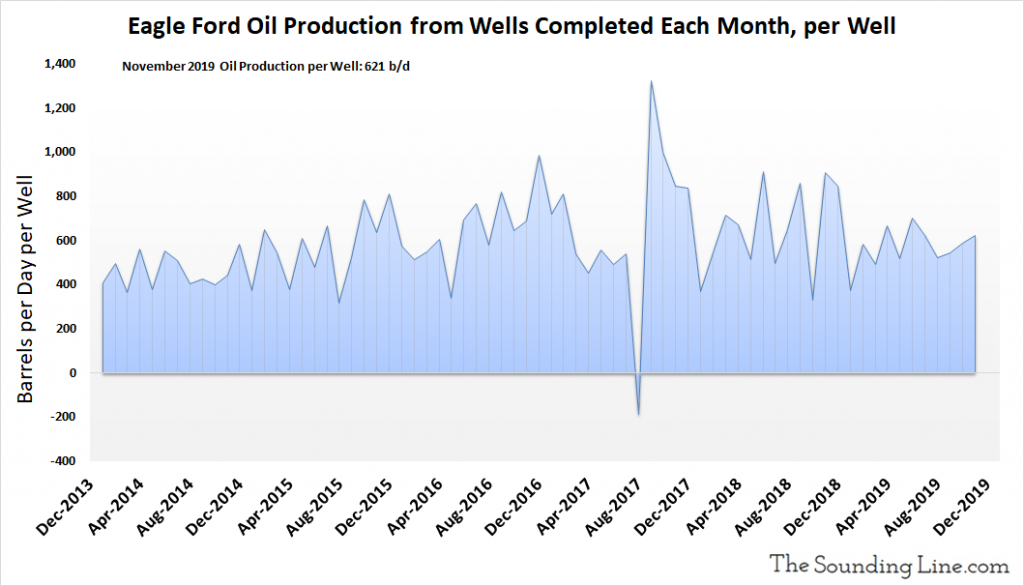
The following chart shows the oil production just from newly completed wells, per well, per month, including DUC wells that were completed. Production per completed well was 621 b/d as of November 2019, roughly the average since 2014. There has been no clear trend of increasing production per new well since at least 2017.
Natural Gas Production
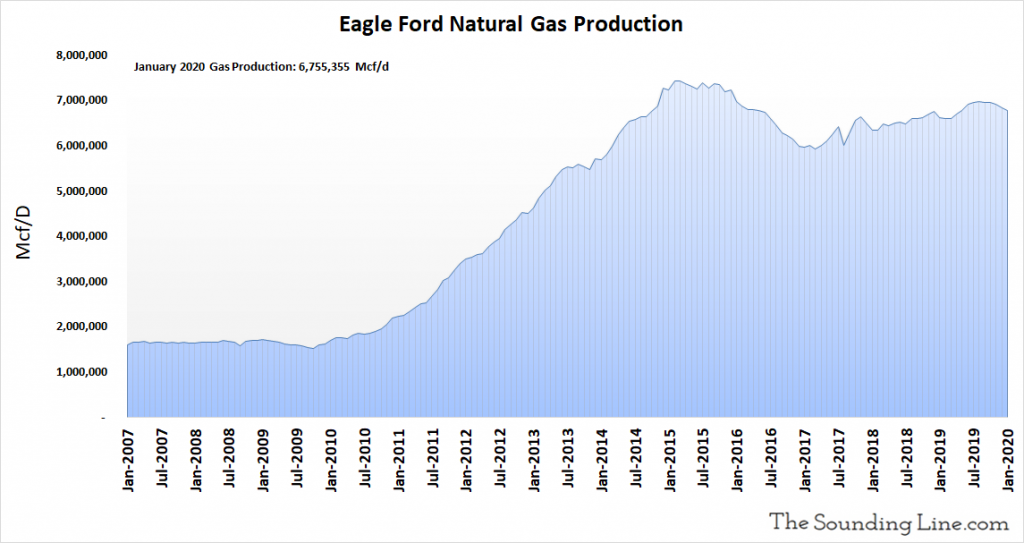
Natural gas production in January 2020 was slightly above 6.75 million Mcf/d. Natural gas production has declined modestly since mid 2019 and is well below the peak level in mid 2015.
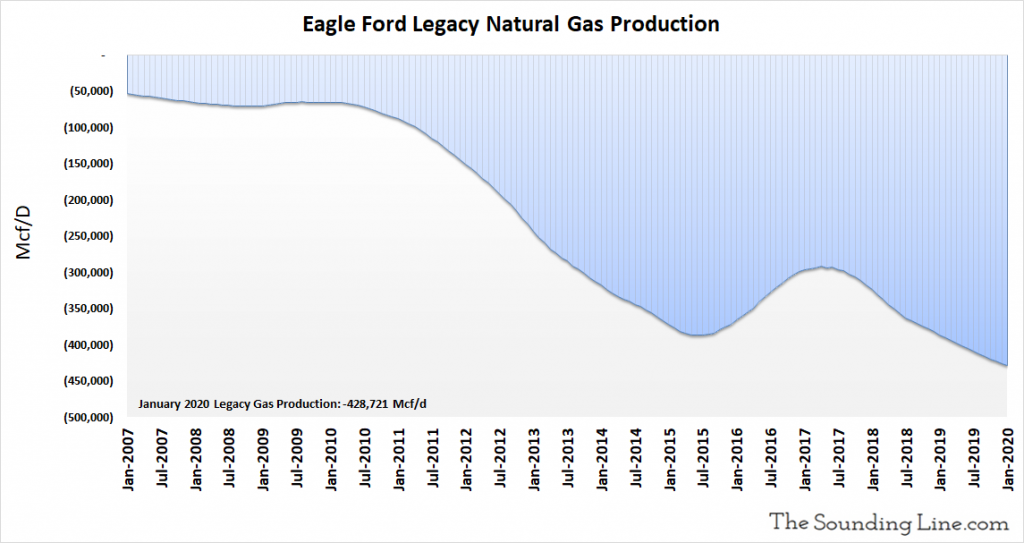
Legacy Natural Gas Production
As with legacy oil production, the following chart shows the production decline rate of wells older than a month. That decline rate reached a record of -428,721 Mcf/d in January 2020.
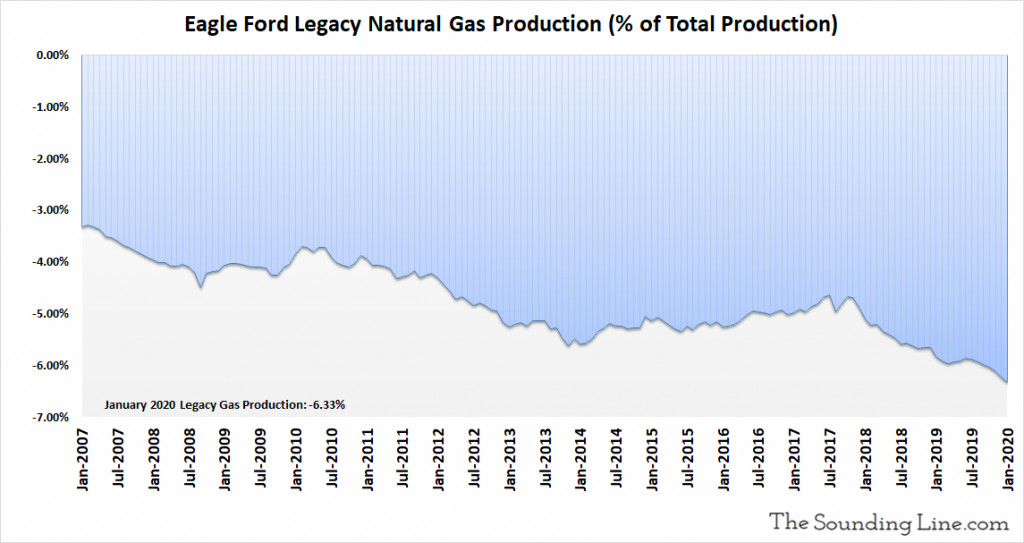
As a percent of total production, legacy declines hit a record of 6.33% of gas production in January 2020.
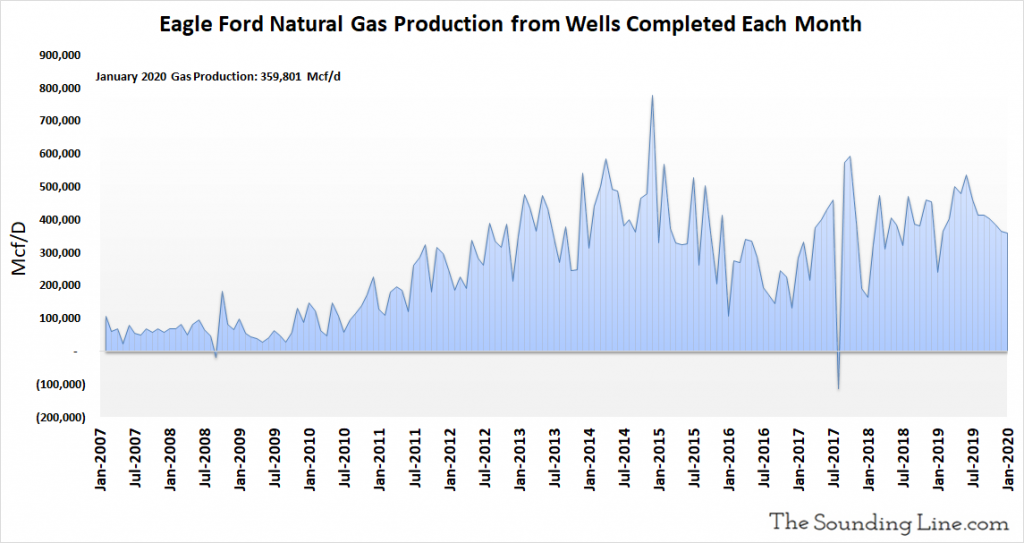
Gas Production from Wells Completed Each Month
The following chart shows the natural gas production from just those wells that were completed in any given month. That may include wells that were previously DUC wells. Production from newly completely wells was 359,801 Mcf/d, as of January 2020. This metric peaked has declined in eight out of the last nine months and peaked in early 2015.
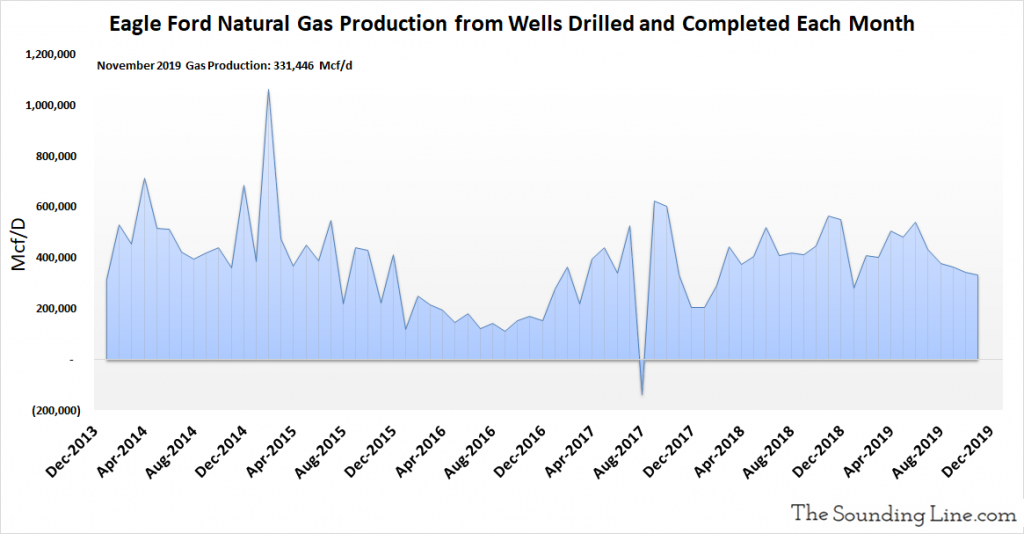
Gas Production from Wells Drilled and Completed Each Month, Excluding DUC Wells
The following chart excludes production from DUC wells completed in a given month and shows the production just from wells drilled and completed each month. It is an inferred number based on changes in production, legacy production, drilled wells, and completed wells. For months where the number of DUC wells increased, the implied production potential of those wells is included in the production figure, even though that gas was not yet produced. Production from newly drilled and completed wells was 331,446 Mcf/d as of November 2019. This metric has shown no clear trend of increasing since at least 2014.
Some Thoughts
Oil and gas production in the Eagle Ford Basin is already in decline. Production of both oil and gas peaked in 2015 and are currently declining modestly. The number of drilling rigs in the field is currently falling, the number of wells being drilled each month is falling, legacy declines in natural gas production are at a record relative to production, and production of oil and gas per newly drilled and completed well have been declining in recent months. There is still a large inventory of DUC wells in the Eagle Ford Basin, though this inventory is being consumed gradually. At the current pace of decline, it will take many years to completely consume the DUC well inventory, though some analysts believe that the EIA’s DUC well figures may be heavily inflated.
Unless the rig count rises significantly and drilling activity accelerates sharply, which would presumably require higher energy prices, there is little reason to expect Eagle Ford oil or gas production to grow.
We will discuss the remaining basins in the coming days and weeks.
Would you like to be notified when we publish a new article on The Sounding Line? Click here to subscribe for free.
Would you like to be notified when we publish a new article on The Sounding Line? Click here to subscribe for free.

