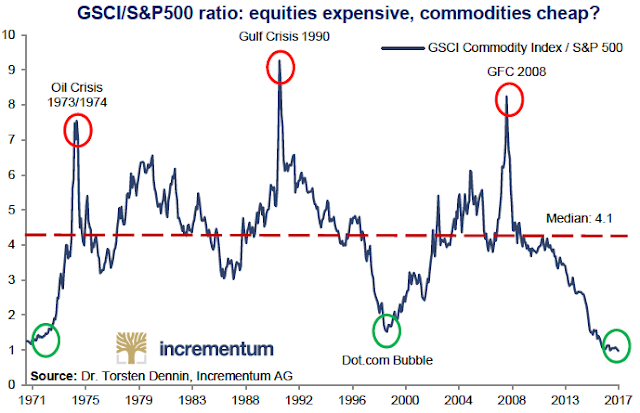
The following chart, from Incrementum AG via Time Price Research, is a dramatic illustration of the divergence in the price of commodities and equities since the 2008 financial crisis.
Enjoy The Sounding Line? Click here to subscribe for free.
Going back all of the way to 1970, the Goldman Sachs Commodity Index (GSCI), an index of 24 commodities from all commodity sectors, has literally never been lower relative to the S&P500.
The vast majority of commodity prices, from industrial metals, to uranium, to fertilizer, have been declining in value since approximately 2011, as global economic activity has slowed, particularly in China.
This chart is yet another warnings that equity prices have reached historic detachment from underlying economic consumption and production of goods. While that may continue for some time as monetary policy around the world remains exceptionally accommodative and economic growth refuses to accelerate, the long term investor should take note.
Would you like to be notified when we publish a new article on The Sounding Line? Click here to subscribe for free.


