Submitted by Taps Coogan on the 18th of May 2016 to The Sounding Line.
Enjoy The Sounding Line? Click here to subscribe for free.
Like nearly all industrial commodities, the price of copper has been declining since 2011. One of the popular narratives to explain this phenomenon is that slow global growth and waning demand are the primary cause of the declining prices.
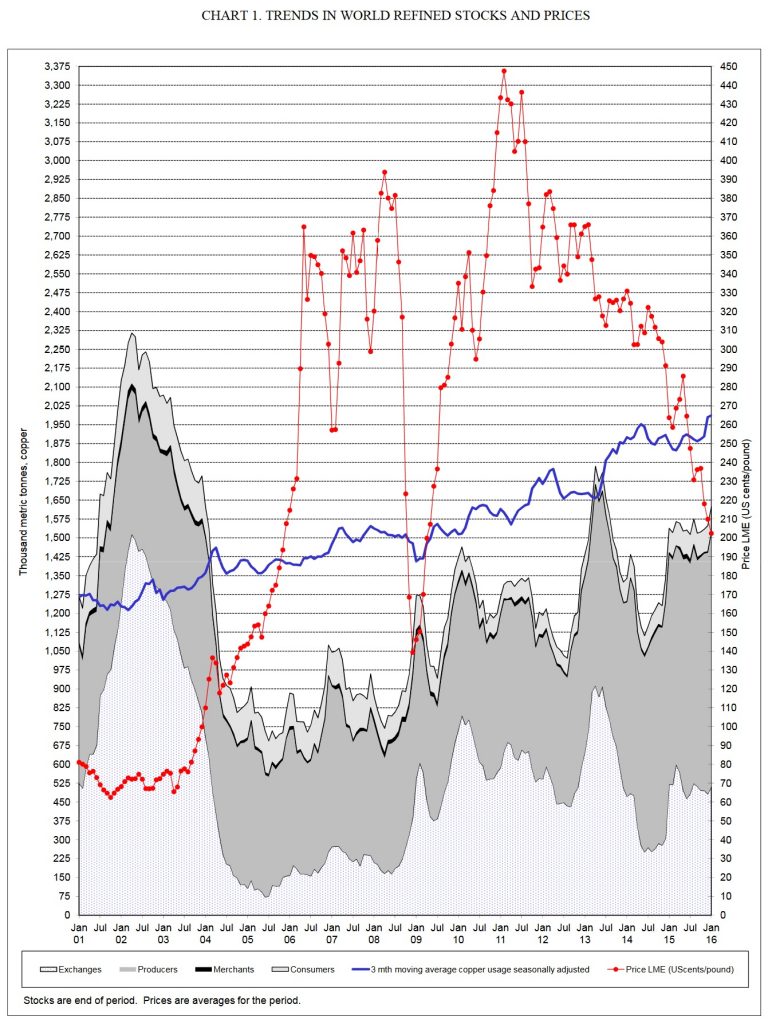
The International Copper Study Group (link here) recently published a very informative chart, show below, which shows the price of copper, the usage rate of copper, and the stocks of copper being held at various stages in the global supply chain. In contrast to the demand side narratives, this chart reveals that copper usage has actually been growing at a healthy rate during the period of declining prices. In fact, copper usage grew by approximately 25% between January 2011 and January 2016, while copper prices fell 55%.

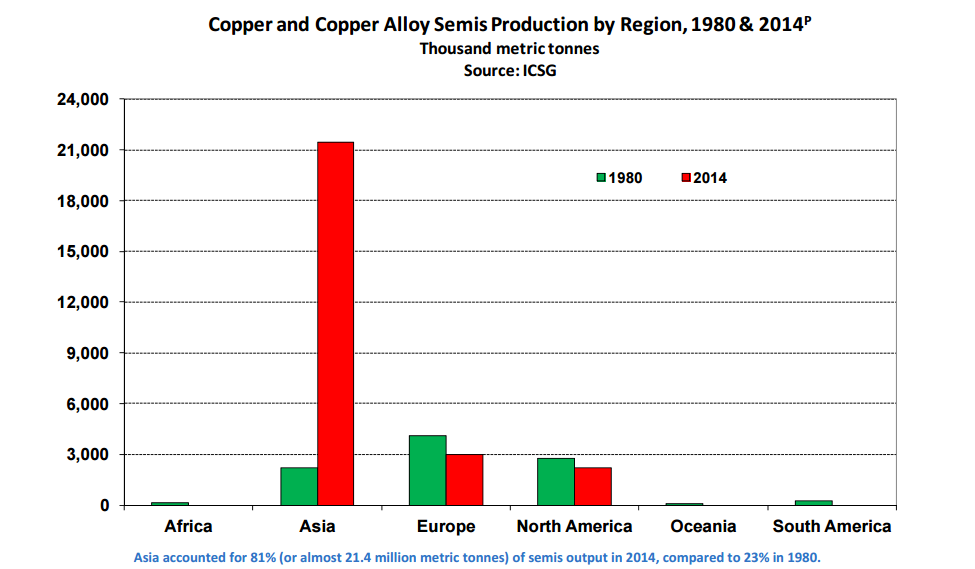
If not demand, one might imagine that it is an over-supply of copper that might be the cause of low prices. And, as evidenced in the above chart, stocks of copper being held by producers (the dark grey area) has grown by over 60% between January 2011 and 2016 while stocks held by other, downstream and in market, elements in the supply chain declined or did not grow substantially. Despite steadily growing usage, some producers have still managed to over produce and build up large excess stocks of copper. As can be seen clearly in the chart below, the source of this rapid production growth is Asia.

Asian copper production has grown astronomically large in the last decades, eclipsing the rest of the world’s production several times over. In fact, copper production has declined in every other region.
Enormous investment, credit growth, years of un-productive GDP-fudging infrastructure projects in China, and nearly a decade of artificially low interest rates have led to massive excess production growth in Asia and particularly China. As producers reach the limit of inventories they are willing to hold, they are increasingly bringing the excess production into the market, driving down prices.
The story is similar for most industrial commodities and fossil fuels and understanding the supply side issues that these industries are contending with is critical to understanding what will most strongly effect price changes moving forward. It is not a lack of demand that has driven prices lower, it is overcapacity brought on by misguided policies and artificial credit creation via low interest rates. It will be the elimination of this overcapacity and, as always, declining purchasing power of currencies that will allow prices to rise. As we discussed in ‘US Oil – What the Rig Count is Telling Us’ (link here) US oil and gas drilling activity and mining production are experiencing their sharpest declines on record in an attempt to stabilize pricing and in order to insure profitability and sustainability, and in the news link on the left hand column of The Sounding Line website, we have been highlighting stories about declining mining all over the world. Clearly a supply side response is emerging from some countries.
Critically however, China remains the largest smelter of copper and the second largest miner of copper. In light of growing economic uncertainty and rising worker discontent (link here) it remains to be seen whether China will follow through on its stated goals of eliminating excess capacity.
Would you like to be notified when we publish a new article on The Sounding Line? Click here to subscribe for free.

