Submitted by Taps Coogan on the 21st of February 2016 to The Sounding Line.
Enjoy The Sounding Line? Click here to subscribe for free.
In Part I of our ongoing series on US trade we discussed how foreign purchases of US debt and dollars have enabled large trade deficits to amass since the 1970s.
In Part II we compared the importance of exports for the ten largest economies in the world. In the event of a global recession or trade war, exports are a small component of the US economy as compared to other large economies.
In Part III we take a high level view of the largest US trading relationships with the objective of identifying the primary source of the US trade deficit.
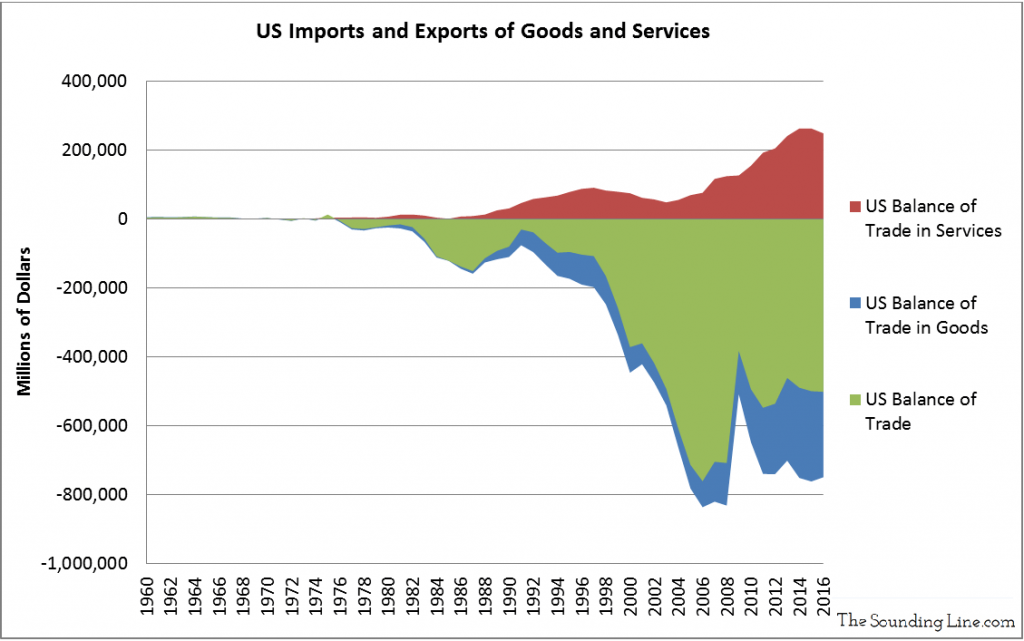
As the following chart shows, the US trade deficit has exploded since the 1970s. While the US is a net exporter of services to the rest of the world, these services are dwarfed by much larger net imports of goods. The result is a half trillion dollar trade deficit.

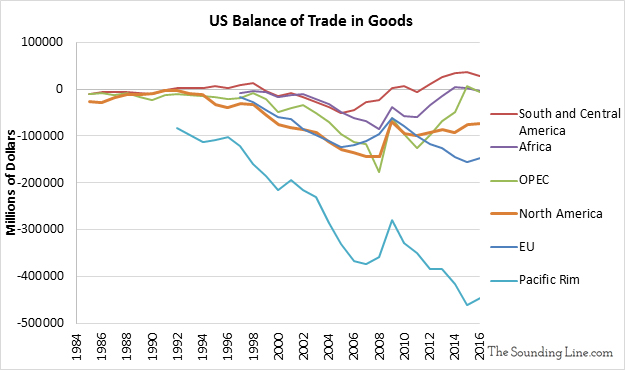
The US trade deficit is a result of imports of goods not services. Focusing exclusively on goods from here on out, the following chart breaks down trade by area of the world. It may surprise some readers to know that the US has balanced trade deficits with OPEC and Africa and even gained a positive balance of trade in goods with South and Central America. However, the US has a negative balance of trade in goods with the rest of North America (Canada and Mexico), and the EU. By far the largest trade deficit is with the ‘Pacific Rim,’ a term which refers to east Asian countries such as China, Korea, and Japan, as well as Australia, New Zealand and everything in between (full list below the chart).

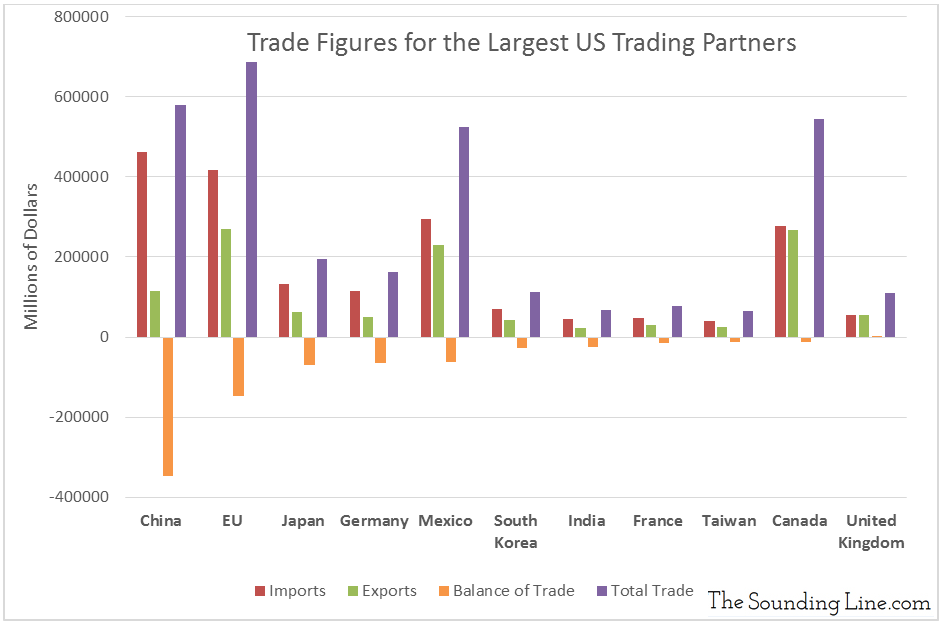
The chart below shows US trade with its ten largest trading partners in 2016, plus the EU. The combined volume of trade in goods (imports plus exports) with the EU, China, Mexico, and Canada, are several times larger than with other countries. These countries represent the largest trading partners of the US. Yet, considering the large volume of combined trade, the US trade deficits with Canada and Mexico are moderate when compared to those of China and to a lesser extent the EU. The trade deficit with China alone is more than twice that of the EU even though trade with the EU is larger. Amazingly, US exports to Canada (a country of 35 million people), Mexico (122 million), and the EU (510 million) are all significantly larger than those to China (1.357 billion people)

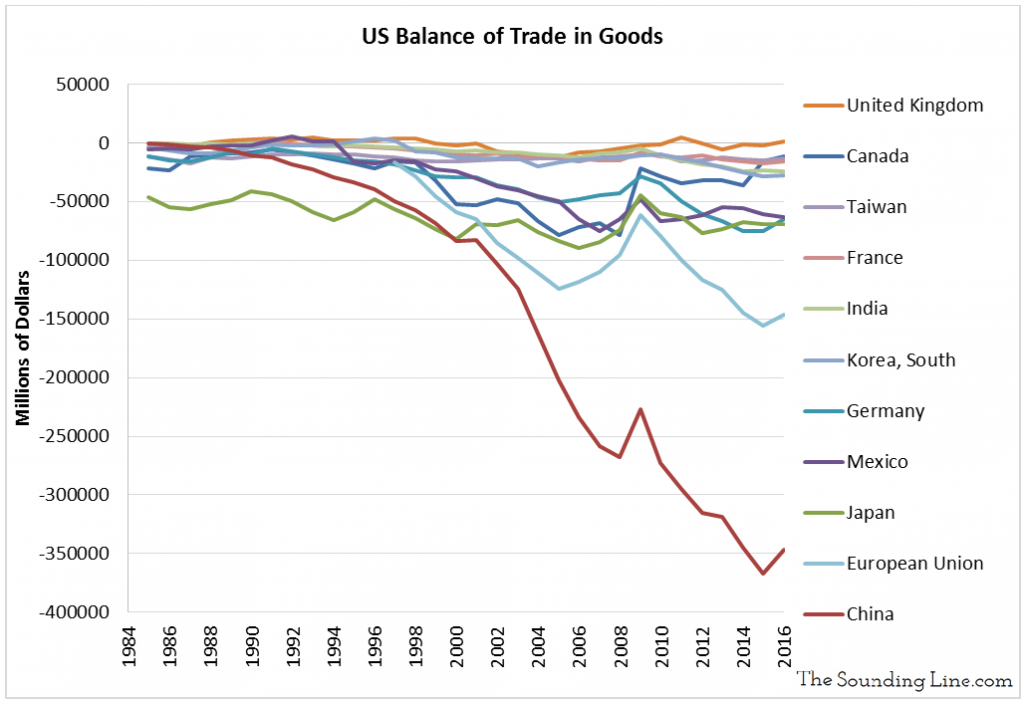
The rapid acceleration of the trade imbalance with China stands out as particularly extreme in the chart below. Having grown from essentially zero in the 1980s, it stands at $347 billion today. That’s a deficit of over $1000 for every man, woman, and child in the US.

From these charts it becomes clear that, while the US runs a trade deficit with all of its largest trading partners (except the UK), it is the trading relationship with China which is driving the massive increase in the US trade deficit. In fact, the US trade deficit with China is larger than all US exports to the EU and is larger than net service exports to the entire world. Far more than with Mexico, Japan, or Germany, if the Trump administration is serious about ‘fair trade’ and balancing trade deficits, a massive reordering of trade relations with China will be unavoidable.
In Part IV of the series we will look at the effect free trade agreements on bilateral trade. Stay tuned!
Would you like to be notified when we publish a new article on The Sounding Line? Click here to subscribe for free.

