Submitted by Taps Coogan on the 2nd of April 2019 to The Sounding Line.
Enjoy The Sounding Line? Click here to subscribe for free.
Enjoy The Sounding Line? Click here to subscribe.
As the UK continues to debate remaining in a permanent customs union with the EU, it is worth taking a moment to reflect on the UK’s already lengthy experience inside a customs union with the EU.
From the UK’s perspective, the primary selling point of being in a customs union is to secure tariff free access for its goods exports to the EU. As a general rule, the EU customs union does not apply to services. If the UK were outside the customs union, its service exports to the EU would not be significantly impacted.
The following charts and statistics are based on data from the UK Office of National Statistics (ONS) and cover 20 years from 1998 through 2017. The figures are adjusted for inflation using the ONS trade deflator data series.
1.) Since 1998, the UK’s exports outside the EU have grown faster than its exports inside the EU. This is true for both goods and services. In fact, the UK’s exports of goods to the EU customs union have grown by only 0.2% per year.
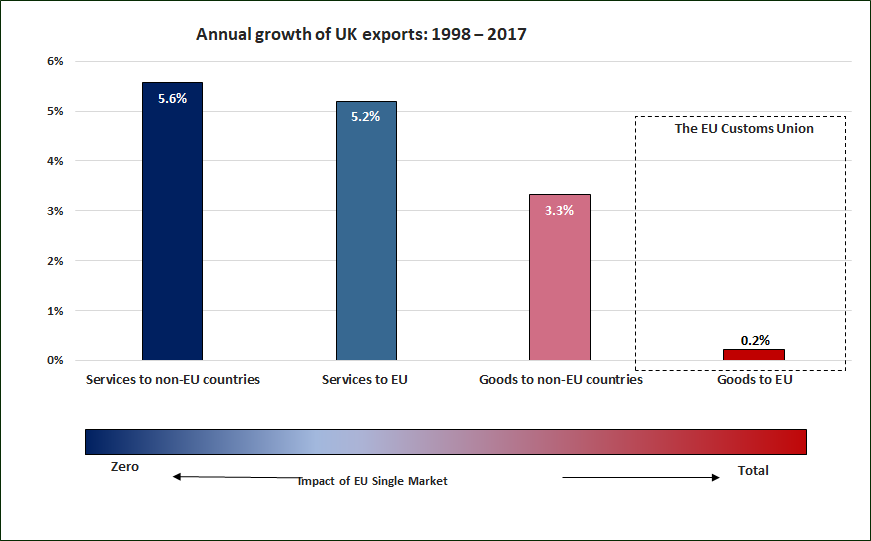
6.) Goods exports to the EU customs union are basically the only part of the UK’s trade complexion that have almost entirely stagnated since 1998. These goods exports are also the only part governed by the EU customs union.
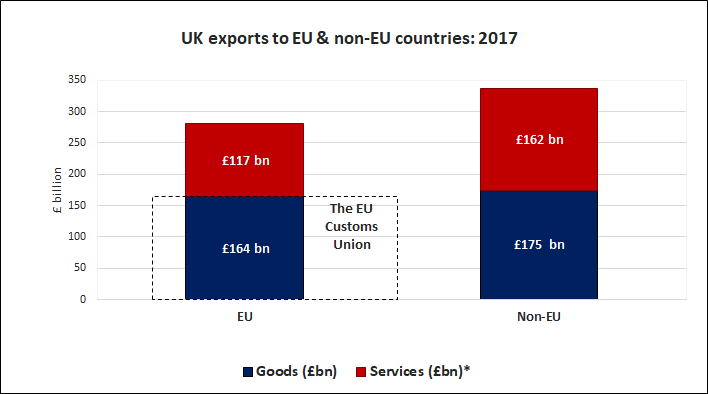
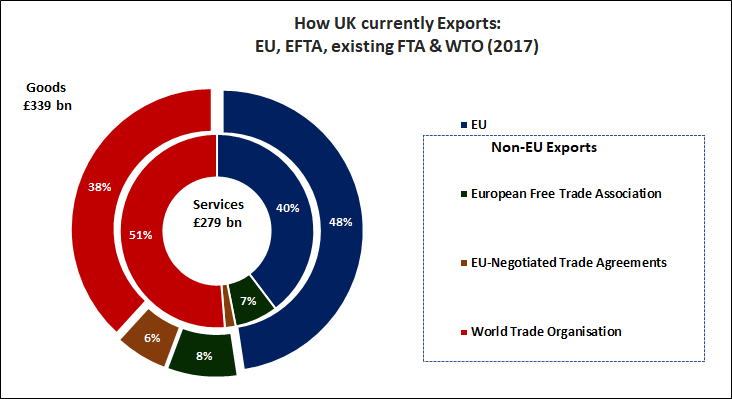
1.) As a result, most of the UK’s exports are now sent outside the EU and the EU customs union. This is true for both goods and services.
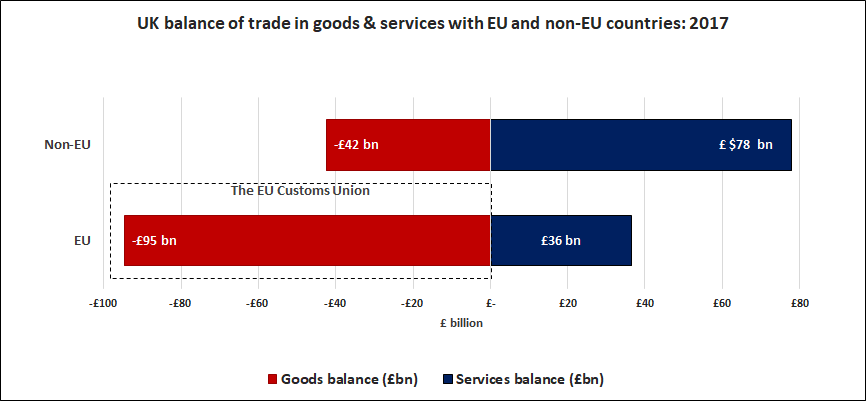
2.) The UK’s trade deficit in goods with the EU customs union is -£ 95 billion a year, over twice the size of its goods trade deficit with the rest of the world, +£ 42 billion. Its trade surplus in services with the EU (+£ 36 billion ) is less than half as large as with the rest of the world, +£ 78 billion. As a result, the UK runs a +£ 35.6 billion goods and services trade surplus outside the EU and a -£ 58.3 billion trade deficit with the EU.
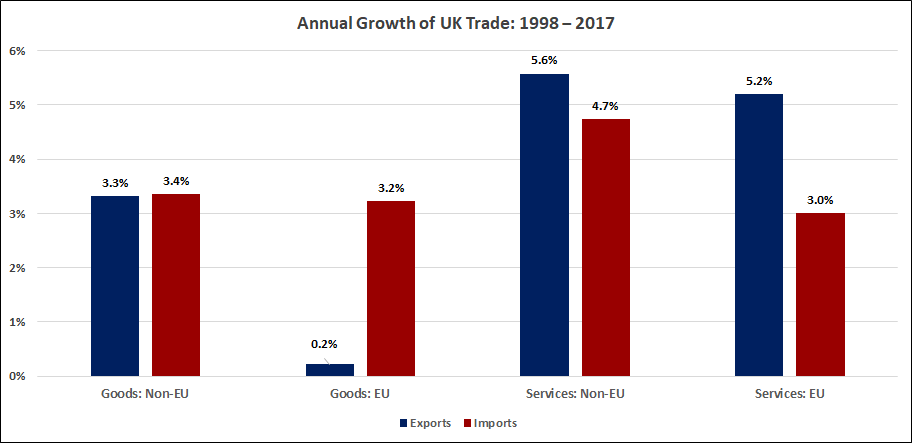
5.) While the UK’s exports to the EU customs union have grown at a very low 0.2% annual rate since 1998, its goods imports from the EU customs union have grown at a robust 3.2% per year.
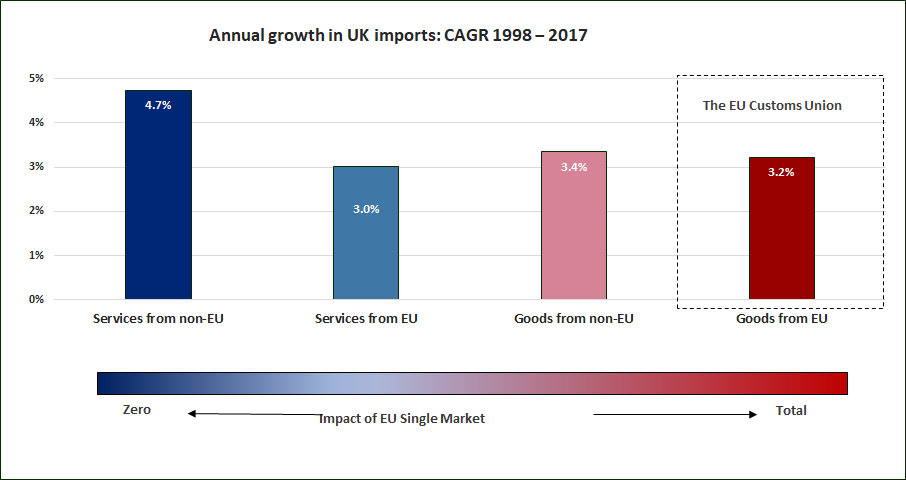
3.) The vast majority of the UK’s fast growing and large trade outside the EU is governed by WTO trade rules (85.1% for services and 72.9% for goods).
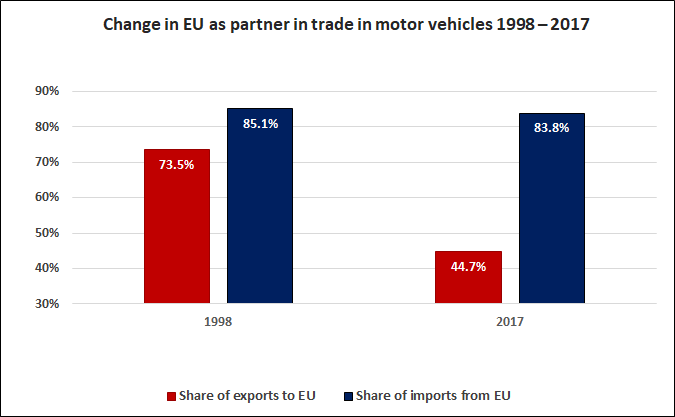
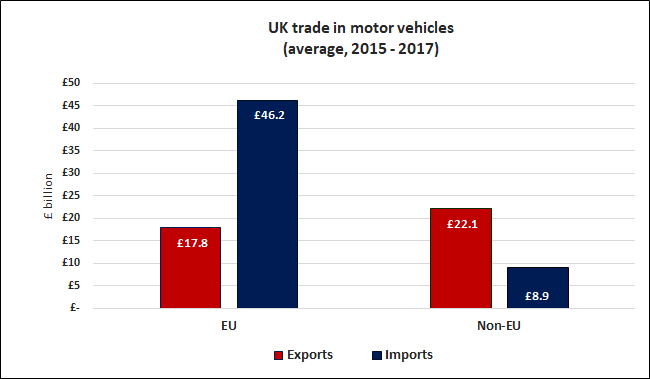
4.) Motor vehicle exports to the EU customs union have fallen from 73.5% of the UK’s auto exports in 1998 to just 44.7% in 2017. Meanwhile, imports from the EU have stayed nearly constant at over 80%. The UK runs an auto-sector trade surplus outside the EU customs union yet a large deficit with the EU customs union.
5.) In not a single one of the UK’s largest goods sectors have exports to the EU customs union grown relative to exports outside the EU customs union since 1998.
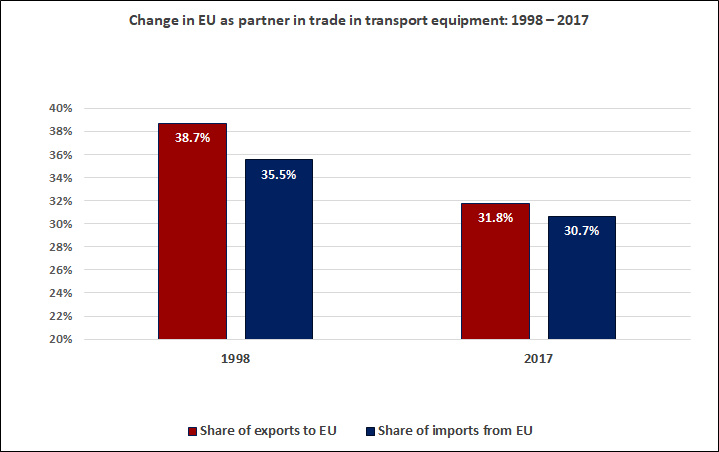
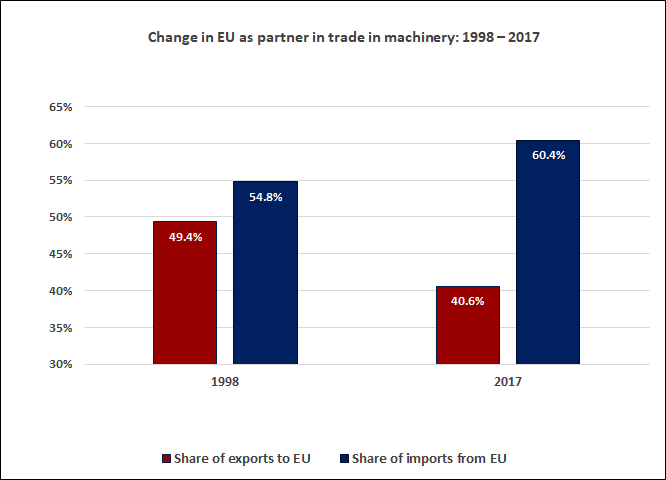
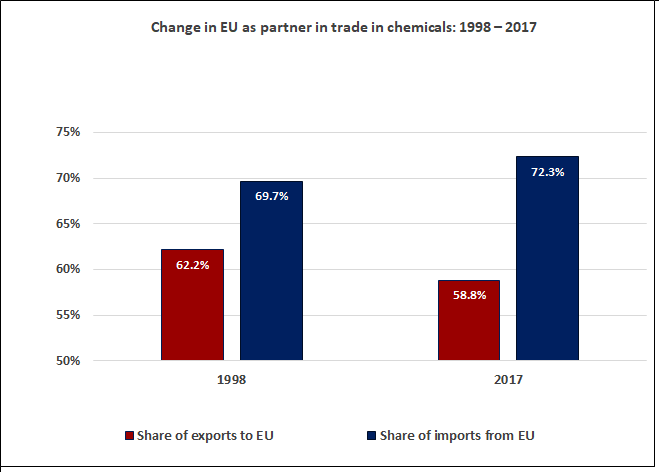
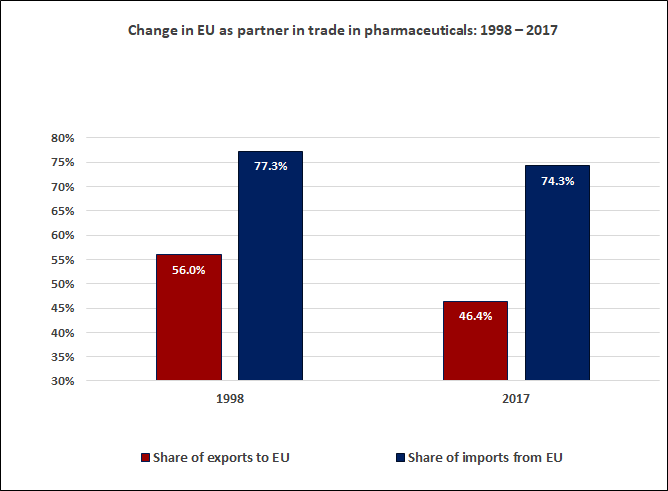
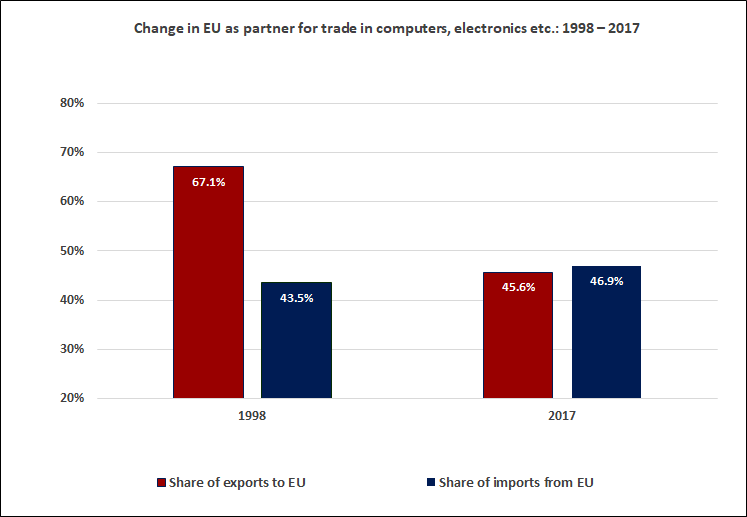
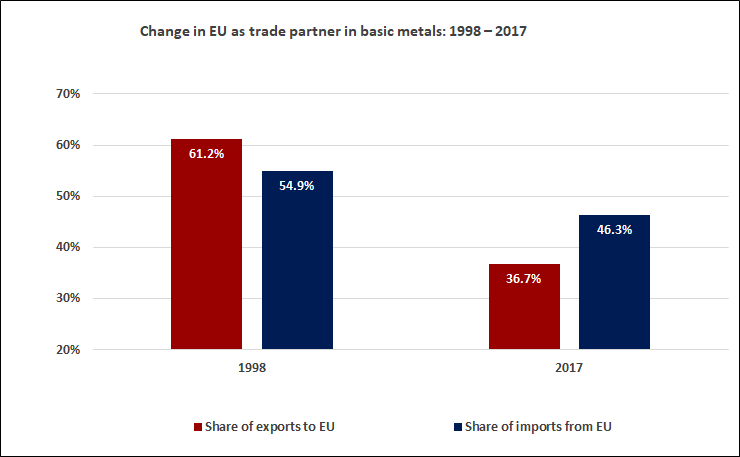
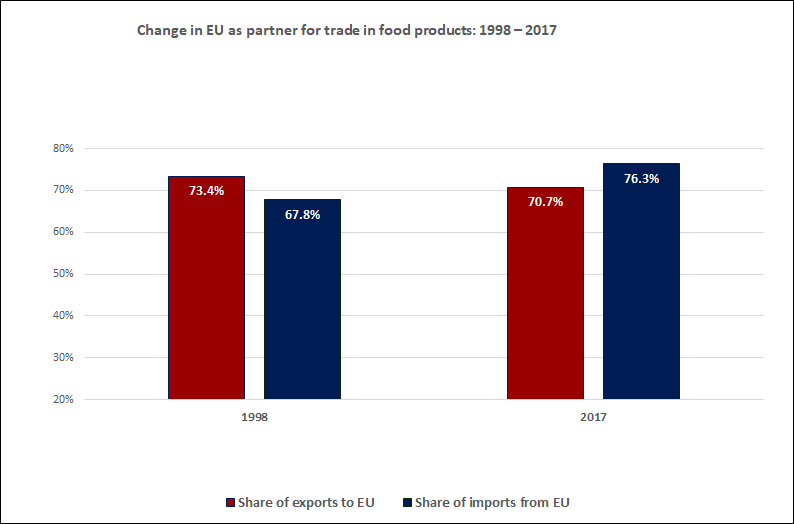
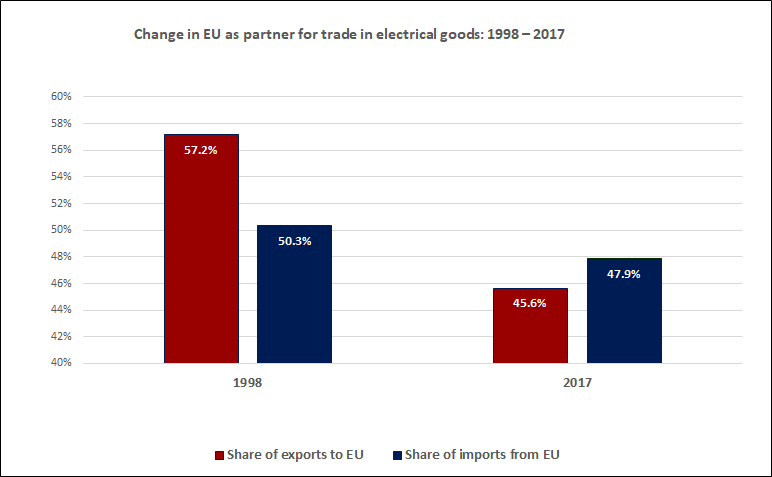
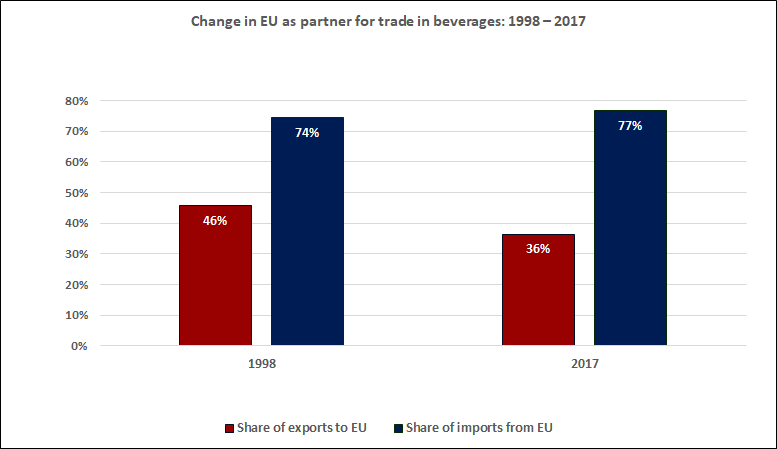
In theory, the selling point of an EU customs union is in helping the UK export more goods to the EU. In reality, the last 20 years have seen the UK’s goods exports to the EU customs union almost completely stagnate while its imports from the EU customs union have surged. Meanwhile, its goods and services exports outside the EU customs union have grown rapidly. There is simply no case to make that the EU customs union is helping the UK grow its exports. To the contrary, it appears that the EU customs union is simply allowing for higher levels of imports of the very goods that the UK is trying to export.
If you would like to be updated via email when we post a new article, please click here. It’s free and we won’t send any promotional materials.
Would you like to be notified when we publish a new article on The Sounding Line? Click here to subscribe for free.


I often check out your posts as they are always an interesting and thought provoking read. Thanks. With respect one or two points you make seem at times to miss the complete picture however, including in this post on the UK’s Brexit mix up. I will mention just a couple of the points here if I may. “From the UK’s perspective, the primary selling point of being in a customs union is to secure tariff free access for its goods exports to the EU” In fact the avoidance of non-tariff barriers is seen by many as the bigger benefit of… Read more »
First off, thanks for a very well written comment. Much appreciated. Fair point when you said ‘This is exceptionally misleading. UK total exports have almost tripled. From 1998 to 2017 for example, from circa £236 to £616 billion.’ I have changed the wording to be more precise. However, your £616 billion figure is counting service exports, which are not covered by the customs union and comprise almost all of the growth and so doesn’t really tell the customs union story. With regards to your larger point about non-tariff barriers: A main economic case for leaving the EU, at least as… Read more »
Thanks again to you Taps, for taking time to consider my comments and to reply, once again so coherently. My comments below are based on similar figures to yours I think, ONS pink book figures in my case from 1999 to 2017), supplemented by some additional figures from 1998. I do not believe UK Goods exports to the EU have stagnated as much as you say. Their annual increase from 1999 to 2017 was around 2.65% not 0.2% as you suggest. Adding in 1998 figures does not affect that much. Goods exports to the EU were disproportionately affected by the… Read more »
Very disappointed to see you have left the incorrect information between the UK and the EU in this report. Disinformation is never helpful and this was pointed out some time ago now. UK/EU growth in trade is ten times the value you have shown, and grew faster in 2017 than that outside the EU, as I explained in an earlier post. I always took you to be more objective than this.
These are literally the official figures from the UK Office of National Statistics. If the trade figures were ten times higher they’d be bigger than the UK’s entire economy…
Taps
What I pointed out was the percentage annual growth of goods exports from UK to EU was 2.65% approximately. Not around 0.2% as you suggest. That comes from the official UK ONS figures on UK trade in the ONS pink book.
Percentage growth in the last two years to EU was also higher than non EU. This indicates growth of exports if goods to the are not stagnating as you suggest.
I did not make a single additional calculation in that article. Every number referenced based on the official UK ONS data, not mine. If you have a link to a figure that says 2.65% annualized growth over the last 20 years on goods exports to the EU please share it. The data used for this article is linked to in the article. I encourage you to click the link and see it yourself.
2mbg6fgb1kl380gtk22pbxgw-wpengine.netdna-ssl.com/wp-content/uploads/2019/02/UK-Trade_Goods-and-Services_BC.xlsx
Alright mystery solved. The data you are talking about is nominal, the data in my article is inflation adjusted, using the official ONS trade deflater data series. Adjusted for inflation the annualized growth in UK exports to the EU IS 0.2%. Nominal it is roughly 2.65%. I will updated the article to state more explicitly that the data is adjusted for inflation, but it doesn’t change the point of the article or the delta between non-EU and EU growth rates. Thanks for continuing to point this out. It’s appreciated
Hi again Taps Thank you for considering this and taking it on board. I realise now you have probably taken figures from a Brexitcentral spreadsheet. I am pretty certain they have their figures wrong somehow, as I have known them to do before. I can not see where they get their figures from the ONS workbook they reference. And I do not believe intuitively that non EU growth was 20 times greater than EU. 70% v 3%. When I spoke to ONS the figures they advised I use was the pink book at the link below…. Tab 9.4. From 1999… Read more »
Annual average growth I made over the period 1999 to 2017 was 2.66 (eu) and 5.5 (non-eu)
We are in agreement. The data in the article is not wrong as far as I can tell though. The difference is that thet ONS data shown above is inflation adjusted, using the ONS trade deflator, which is the right way to do it, and inflation adjusted is, in my opinion, probably the right way to view the trends in trade.
Taps : Hmm .. well.. sadly we are not in agreement. The Brexitcentral report points to a source of information – an ONS document which does not carry any information like this that I can see. How they deduced it from that I have no idea. In contrast referring to the explicitly named figures in the ONS Pink book which I linked shows EU goods export and thus growth as follows 1999 to 2017. (£ million) EU goods exports 1999 2017 102353 164085 Non EU Goods exports 1999 2017 93839 312234 These are all actual figures. That can not possibly… Read more »
If the EU figure is inflation adjusted then so should be the non EU for meaningful comparison.
Taps.. Nope – I am wrong the non EU figure has had 2.4% taken off it too. My protracted mistake. That said I still think this gives an unfortunately inaccurate perspective. A comparison of trade growth during the period including the Eurozone’s own credit crunch, forgetting trade deals extended elsewhere rising to 60 countries and the championing of non EU trade via the EU.
As I say too, latterly EU growth outstripped non EU. However these are different points and on the one I was labouring I was wrong. Apologies for the lengthy controversy.
No problem at all. The discussion was informative for me. Many different ways to interpret something like Brexit
how much of the UK’s EU imports are re-exported outside the EU?
Great question. I’ll look into it but I am not sure that data is gonna exist
There are no confirmed figures on this apparently. However ONS, the official provider of staistics on UK trade suggest that figure is around 2% of all goods exported to EU. Explained in this site, but that estimate can no doubt be confirmed with ONS.
https://fullfact.org/europe/uk-eu-trade/
Approximately 2% according to ONS estimates.