Submitted by Taps Coogan on the 9th of July 2018 to The Sounding Line.
Enjoy The Sounding Line? Click here to subscribe for free.
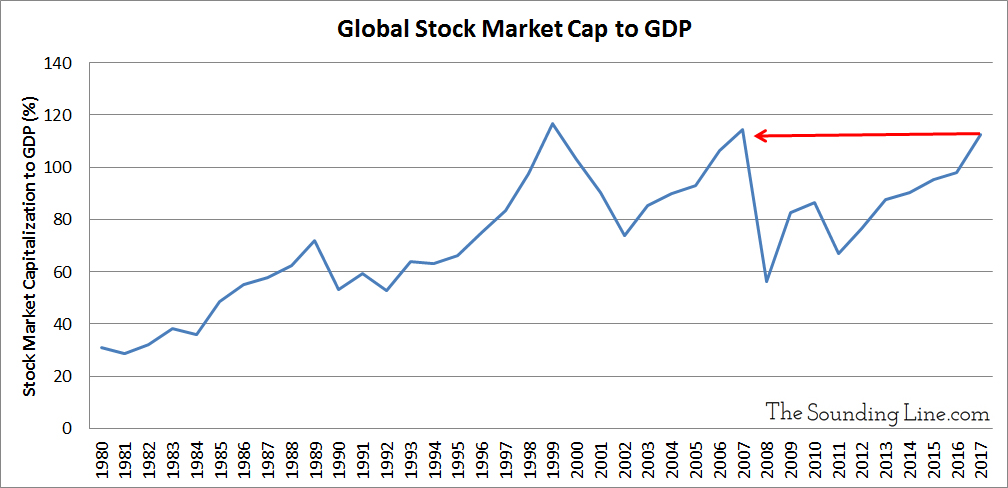
As the following chart shows, the stock market capitalization of all publicly traded companies in the world exceeded 110% of global GDP in 2017 for just the third time on record. The other two times the ratio has reached similar levels were at the height of the Dot-Com Bubble in 1999 and the height of the Housing Bubble in 2007. Both previous instances were followed by market sell-offs and recessions.

2017’s exceptionally bullish global run in equities has not yet been repeated this year, yet GDP growth has remained positive in most major economies. If this trend continues through the second half of the year, the global market cap-to-GDP ratio is unlikely to surge much higher in 2018. It may even decline. Coincidentally, every decline in the ratio since 1980 has occurred during or in the year prior to a recession or major economic disruption (expect in 1984): the early 1980s recessions, the early 1990s recessions, the early 2000 recession, the Great Recession, and the 2011-2012 European Sovereign Debt Crisis.
When stock prices rise far faster than the underlying economic growth upon which corporate profits ultimately rely, historically, it has proven unsustainable. While 2017’s near record global market-cap-to-GDP ratio by no means implies that the dramatic appreciation of stock prices is over, it does mean that the current bull market is nearing record breaking territory and that, ultimately, it is likely unsustainable.
P.S. If you would like to be updated via email when we post a new article, please click here. It’s free and we won’t send any promotional materials.
Would you like to be notified when we publish a new article on The Sounding Line? Click here to subscribe for free.

