Taps Coogan – March 5th, 2023
Enjoy The Sounding Line? Click here to subscribe for free.
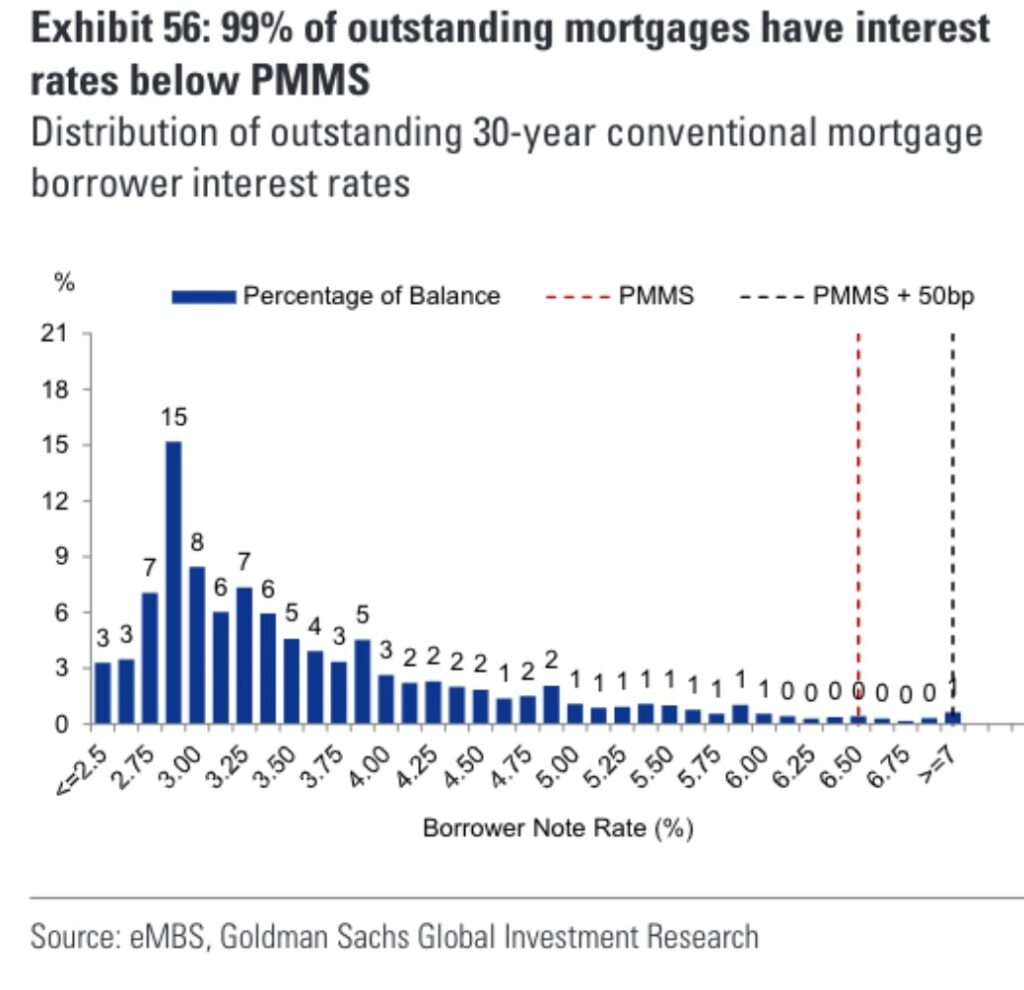
The following chart, from Goldman via Lance Lambert, is a reminder of how long the housing correction we have started is likely to last.

The punchline of the chart is that 99% of current mortgages have rates below today’s prevailing rate (the Primary Mortgage Market Survey rate or PMMS). Indeed, the majority of mortgages are still under 3.5%.
That reality has a couple of big implications.
The first is that as liquidity tightens and bank deposit rates converge with the Fed Funds rate, the cost of funds for banks will be higher than the yield on over 90% of mortages out there today. That’s bad news for anyone that finances their MBS holdings.
Second, the downturn in housing may be surprisingly slow and drawn out. Very few home owners have mortgage rates that reflect today’s fundamentals and even fewer have high, variable rate mortgages. Homeowners are now heavily incentivized to stay in their current home and keep paying off their mortgage, which probably has a rate below the inflation rate and maybe even their wage growth rate. That means defaults may take time to build and the supply of existing homes into the market should remain low, dragging out the process of home prices reflecting today’s very challenging mortgage costs.
Would you like to be notified when we publish a new article on The Sounding Line? Click here to subscribe for free.


fundinentals?
Thanks. Fixed it
I posted this elsewhere and I’ll just leave it here as well. Housing has become like a stock and it’s price is going to reflect that. Are the big players, the whales, going to sit on 100,000 homes all falling in price until the bottom? Or buy more? Do big players buy into weakness or sell? What about the Airbnb factor? How many bought with that in mind? Is that going to remain profitable? How about the boomers, are they going to keep the 2nd home, the beach house and the mountain cottage? Fact of the matter is we won’t… Read more »