Taps Coogan – June 16th, 2021
Enjoy The Sounding Line? Click here to subscribe for free.
Enjoy The Sounding Line? Click here to subscribe.
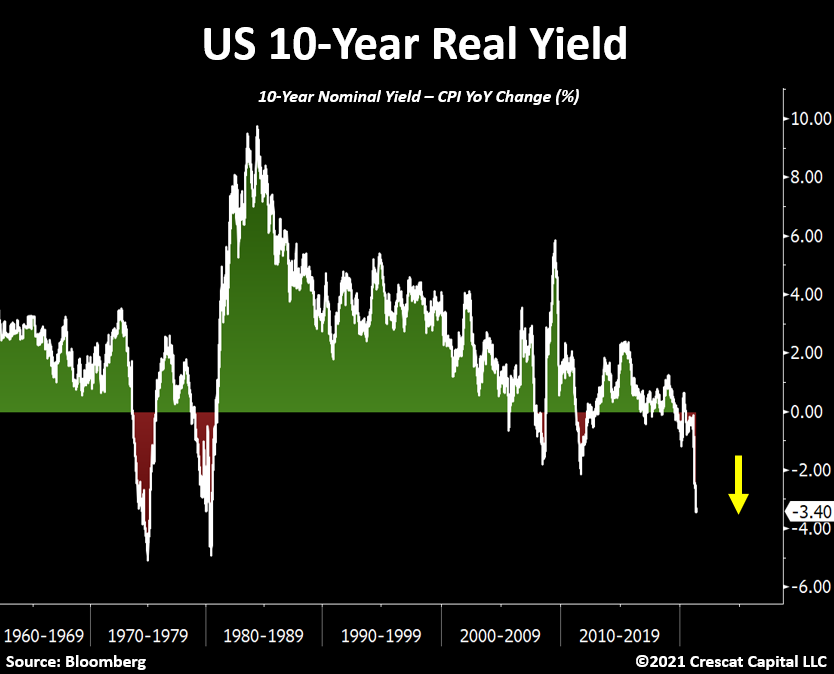
Despite the years of negative real and nominal interest rates in Europe and Japan, and despite years of zero interest rate policy and QE in the US, negative real long term treasury yields have actually been a rare occurrence in the US, as the following chart from Crescat Capital’s Otavio Costa reveals.

This is one of those rare times.
These episodes don’t last long because they tend to lead to very high inflation. Here is the track record for the four prior times yields traded negative for any meaningful period of time:
CPI hit 5.5% in August 2008, in the middle of a recession, and 3.5% in September 2011.
CPI hit 14.5% in 1980 and 12.2% in 1975, both times also in the middle of recessions.
The creator of the chart above argues that the chart is bullish for gold.
Were the previous times that real yields went deeply negative bullish for gold? After a year or two, each of those episodes ended up marking the period high in gold and inflation (2011, 2008, 1980, 1975). It’s only bullish if you think real yields get even more negative from here.
The most recent inflation print put CPI inflation at a whopping 4.9%. Sooner or later, the Fed is going to knock off the buddy-buddy savoir-of-the-world act and start doing its actual job.
Would you like to be notified when we publish a new article on The Sounding Line? Click here to subscribe for free.
Would you like to be notified when we publish a new article on The Sounding Line? Click here to subscribe for free.


The powers that be simply distort the inflation rates keeping secure returns on investments at the whim of the market !!! The average saver is being conned !!
You mean ROBBED!
This isn’t the way savings are built for retirement.
We’re at the mercy of the stock market now.
Indeed