Submitted by Taps Coogan on the 24th of September 2019 to The Sounding Line.
Enjoy The Sounding Line? Click here to subscribe for free.
Enjoy The Sounding Line? Click here to subscribe.
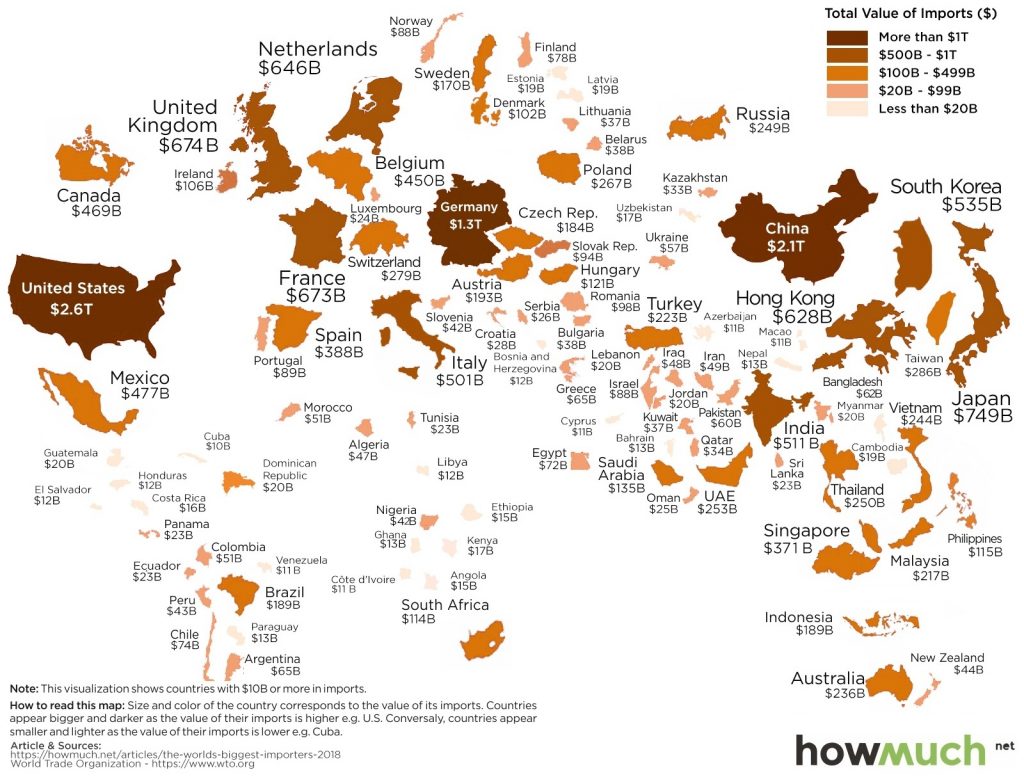
The following map, from HowMuch.net, shows the world scaled according to the value of the goods that countries imported in 2018, based on data from the World Trade Organization.

Not too surprisingly, the United States is the largest importer in the world, having imported $2.9 trillion of goods in 2018. Not too far behind the US is China, which imports $2.1 trillion of goods per year. Germany is the world’s third largest importer, with $1.3 trillion of imports.
Despite China’s deserved reputation as a major exporter, as the map above highlights, China has also become a major importer. As we discussed here, China would only run a modest trade surplus with the rest of the world if its trade surplus with the US were eliminated.
The largest importers in the world are:
| Rank | Country | Imports (2018, $M) | Share of Global Total |
| #1 | United States | $2,614,327 | 13.20% |
| #2 | China | $2,135,905 | 10.80% |
| #3 | Germany | $1,285,644 | 6.50% |
| #4 | Japan | $748,735 | 3.80% |
| #5 | United Kingdom | $673,549 | 3.40% |
| #6 | France | $672,593 | 3.40% |
| #7 | Netherlands | $646,029 | 3.30% |
| #8 | Hong Kong, China | $627,517 | 3.20% |
| #9 | Korea, Republic of | $535,202 | 2.70% |
| #10 | India | $510,665 | 2.60% |
| #11 | Italy | $500,795 | 2.50% |
| #12 | Mexico | $476,569 | 2.40% |
| #13 | Canada | $469,000 | 2.40% |
| #14 | Belgium | $450,116 | 2.30% |
| #15 | Spain | $388,044 | 2.00% |
To the a similar map of the world’s exports, read here.
Would you like to be notified when we publish a new article on The Sounding Line? Click here to subscribe for free.
Would you like to be notified when we publish a new article on The Sounding Line? Click here to subscribe for free.

