Submitted by Taps Coogan on the 10th of April 2020 to The Sounding Line.
Enjoy The Sounding Line? Click here to subscribe for free.
Enjoy The Sounding Line? Click here to subscribe.
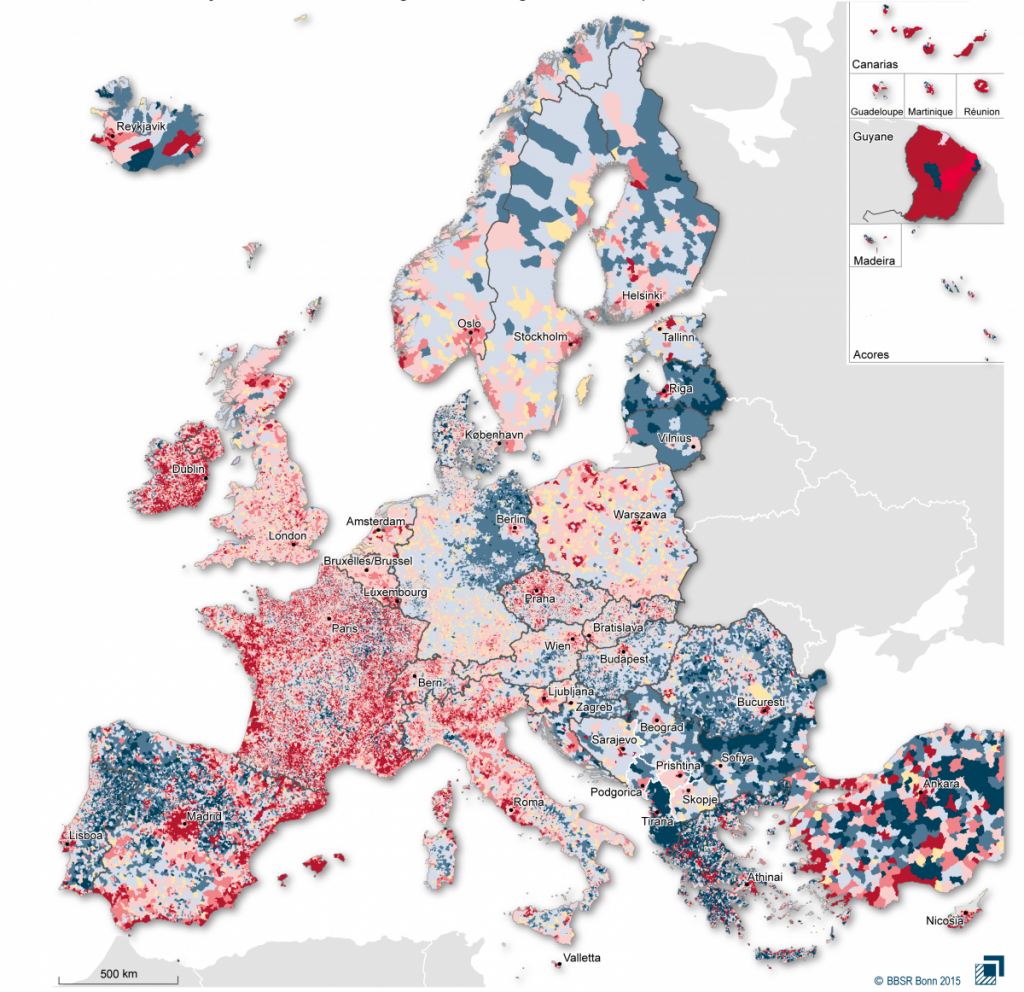
The following interactive map, from Berliner Morgenpost, shows the population growth (or decline) for every municipal region of nearly every country in Europe. The data, the most recent available, is for the decade from 2001 through 2011. To activate the interactive map, click on it (the initial message is in German). To see it in full screen, click here.
Here is a static image version of the same data, via BBSR.

Would you like to be notified when we publish a new article on The Sounding Line? Click here to subscribe for free.
Would you like to be notified when we publish a new article on The Sounding Line? Click here to subscribe for free.

