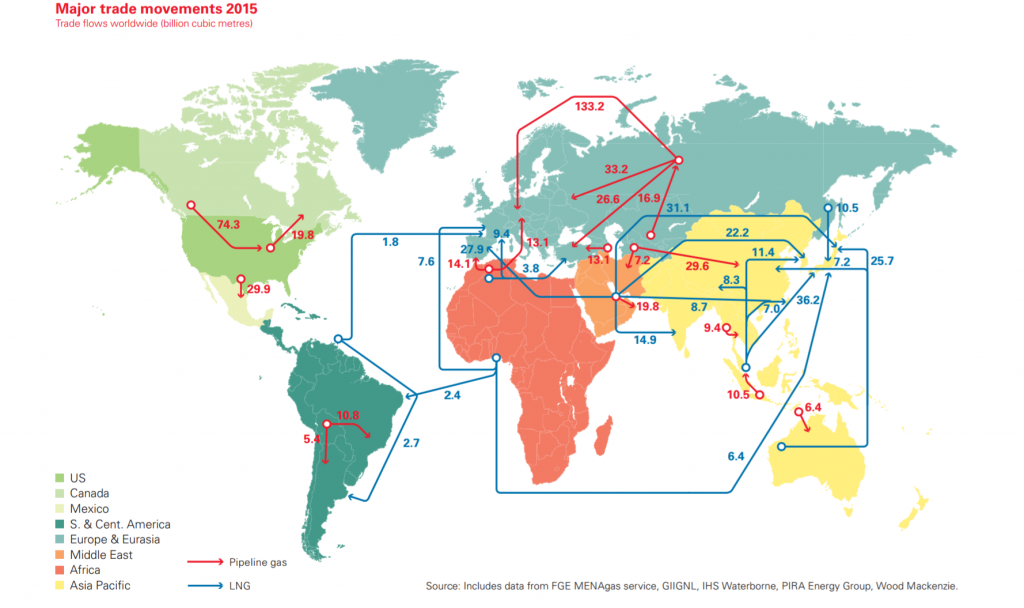
We recently came across this chart, courtesy of BP (here), which shows the global trade of natural gas, both by pipeline (red) and shipping (liquefied natural gas – LNG – blue). The figures date from 2015, the most up to date we could find, and highlight some of the larger themes in natural gas markets quite succinctly. Russia’s natural gas exports to Europe are the largest flows in the world, nearly twice the next largest. In second is the flow of gas from Canada to the US. Interestingly the US sends quite a bit of natural gas back to Canada too. Qatar is the largest exporter of LNG (the blue lines) with the lion’s share going to Japan, which is the largest importer of LNG. With most of Japan’s nuclear power still offline following the Fukushima disaster, that trend is likely to continue.
Enjoy The Sounding Line? Click here to subscribe for free.

Would you like to be notified when we publish a new article on The Sounding Line? Click here to subscribe for free.

