Submitted by Taps Coogan on the 24th of July 2018 to The Sounding Line.
Enjoy The Sounding Line? Click here to subscribe for free.
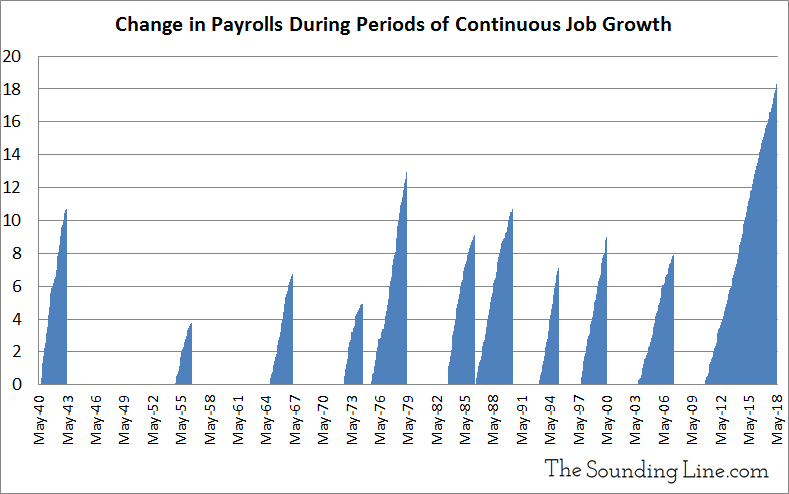
The following map shows the unemployment rate in every state in the US (plus the District of Colombia) as of July 2018. As we first noted here, the US has added a record 18.3 million jobs since 2010, bringing the US unemployment rate to 3.9%, the lowest level since 1969.
The state with the lowest unemployment rate in the US is Hawaii at just 2.1%, followed by North Dakota at 2.6%, and Colorado at 2.7%. The states with the highest unemployment rates are West Virginia (5.3%), the District of Colombia (5.6%), and Alaska (7.1%).

This is our first experiment with the mapping platform Tableau, so if you encounter any problems viewing the map please let me know. I hope to publish more detailed and interesting maps in the future, if users don’t have a problem with it.
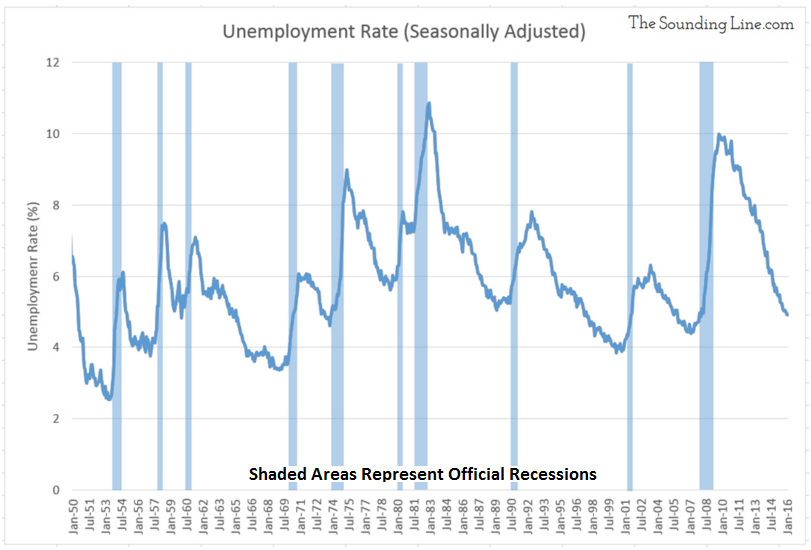
As we have frequently noted, the US has not traditionally stayed at a state of full employment for very long. Since World War II, there has been an average of less than four months from the peak in continuous job growth until the start of the next recession.

P.S. If you would like to be updated via email when we post a new article, please click here. It’s free and we won’t send any promotional materials.
Would you like to be notified when we publish a new article on The Sounding Line? Click here to subscribe for free.

