Submitted by Taps Coogan on the 19th of April 2018 to The Sounding Line.
Enjoy The Sounding Line? Click here to subscribe for free.
According to a recent report by the Health Effects Institute (HEI) and the IHME, global air pollution levels have become dangerously high for huge swaths of the world’s population. The report states that: “95% of the world’s population lives in areas exceeding WHO (World Health Organization) guidelines for healthy air” and “nearly 60% lives in areas that do not meet even the least-stringent air quality target from WHO.”
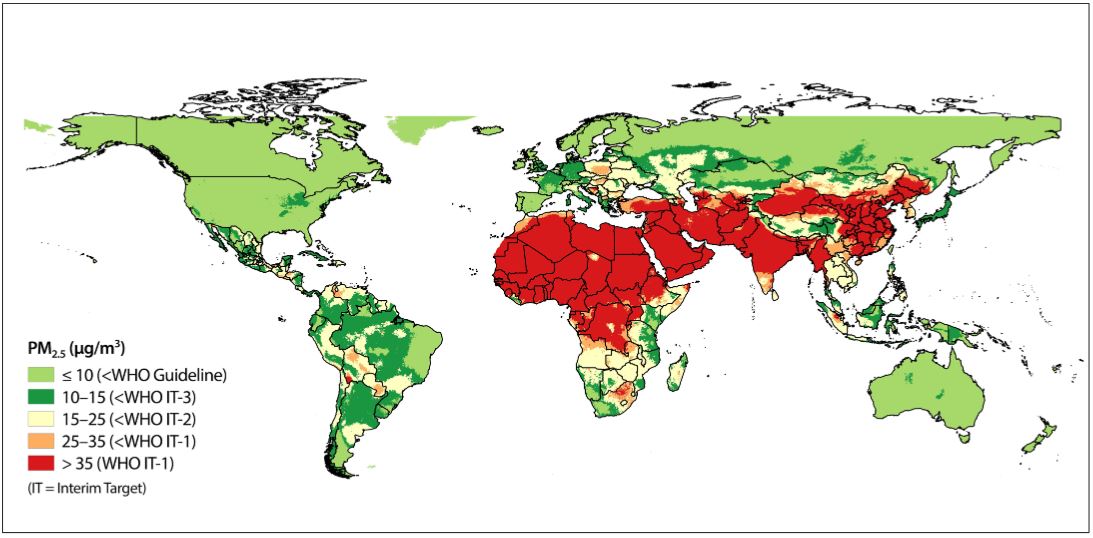
The following map shows the concentration of air pollution based on the average annual concentration of population weighted particulate pollution in 2016. For a more precise definition of the units, refer to the report here.
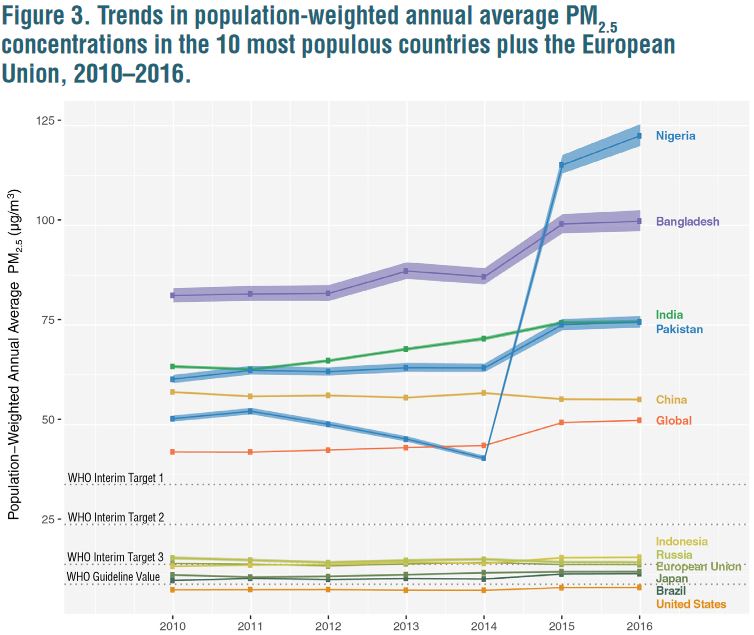
 As the chart above reveals, the pollution problem is gravest in Africa, the Middle East, Central Asia, India, and China. With very few exceptions, average annual pollution levels are above the WHO’s least stringent air-quality targets across these regions. As HEI notes, the highest concentrations were in Niger (204 μg/m3), Saudi Arabia (188 μg/m3), and Cameroon (140 μg/m3). The average levels in China and India were also far above the least stringent air-quality target. For many of these countries, not only are pollution levels high, they are rising rapidly.
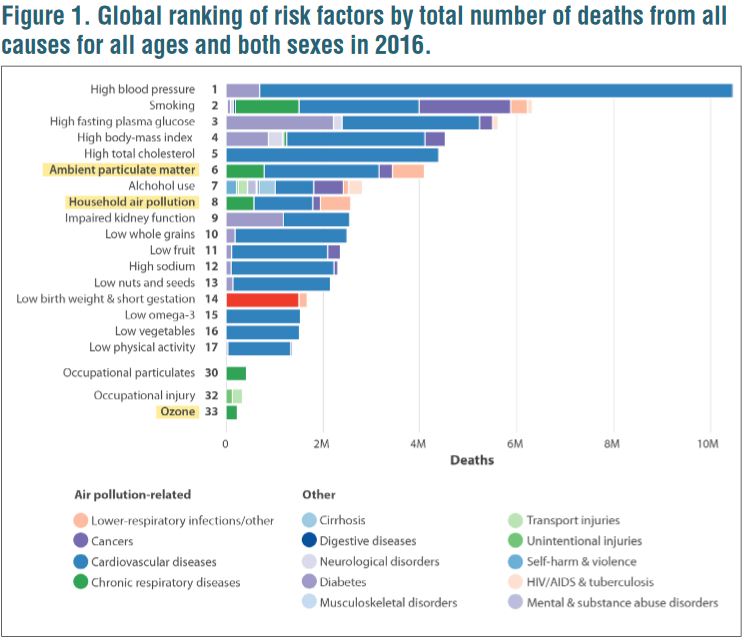
 By comparison, air quality in most of North America, Australia, Russia, and parts of Europe is near or below the WHO’s guidelines for healthy air. Accordingly, it may be easy for residents of these developed countries to overlook just how bad air pollution can be in other parts of the world. Yet the problem is deadly serious. As the following chart shows, air pollution has become a leading risk factor for chronic respiratory illnesses, respiratory infections, and cardiovascular diseases.
 The regions of the world with the worst air quality are many of the least economically developed and fastest growing. In order to cheaply and quickly grow their economies and support their booming populations, they have relied on the cheapest energy and transportation technologies available with apparent disregard to expensive and complication emissions control systems and clean technologies. Reducing pollution while continuing to remain highly economically competitive is a balancing act that has proved elusive for even the best capitalized countries. How the third world will manage the balance is hard to imagine.
P.S. If you would like to be updated via email when we post a new article, please click here. It’s free and we won’t send any promotional materials.
Would you like to be notified when we publish a new article on The Sounding Line? Click here to subscribe for free.


Great article and visuals… It might be worthwhile for you to take a peak at https://aqicn.org/ as they have some real time measurements on a city by city basis. Delhi- https://aqicn.org/city/delhi/dtu/ is one of my favorite…only because red is my favorite color. (cough, hack, cough)
I live in Hong Kong and I check the Air Quality Index every day, and I’m not familiar with micrograms/square meter, as it compares with parts per billions, but your graphic gives you a great perspective on the direct tax a developing country places on its population.
Keep up the good work.
Interesting links. Thanks for the comment
This information is very helpful me. I have to say that for the last few of hours i have been hooked by the impressive articles on this website.