Submitted by Taps Coogan on the 20th of April 2019 to The Sounding Line.
Enjoy The Sounding Line? Click here to subscribe for free.
Enjoy The Sounding Line? Click here to subscribe.
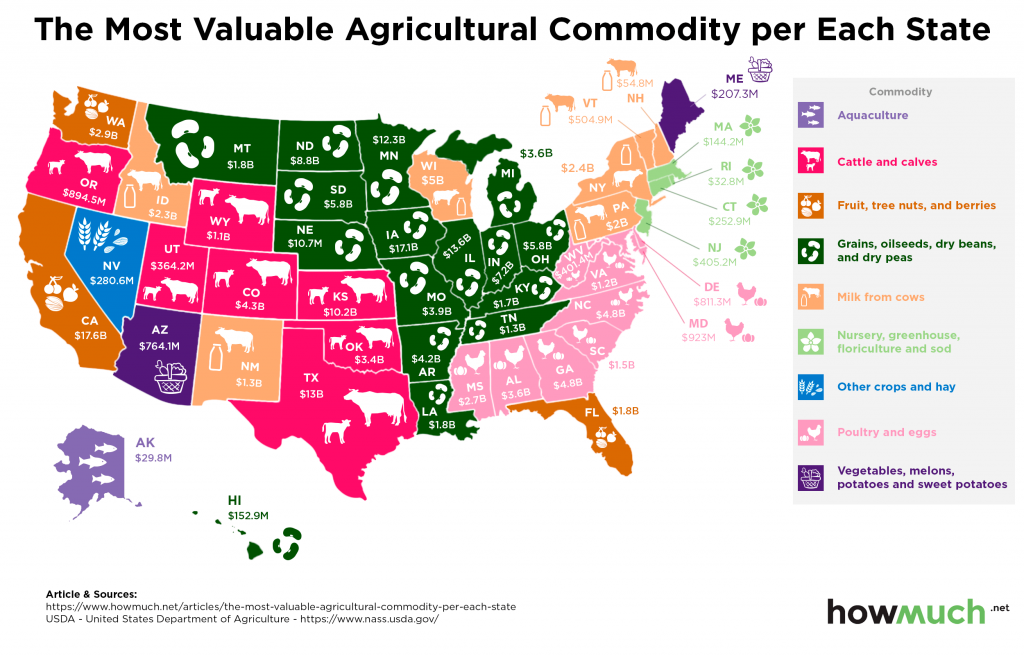
The following chart, from the cost estimation website HowMuch.net, shows the top agricultural product from every state.

As HowMuch notes:
“The United States is the world’s largest exporter of agricultural products, and is also one of the top food-producing countries due to its large expanse of land and relatively low population density. According to the 2012 census of agriculture, the U.S. has 2.1 million farms, covering 915 million acres. Even though every state is involved in the agriculture industry, the vast majority of farms are found in the Midwest/Great Plains area, due to this region’s flat, arable land.”
The map reveals some regional trends in US agriculture, of course with exceptions: dairy in the North-East, poultry in the South, grains etc… in the the Mid-West, cattle in the West, and fruits and nuts in California, Florida, and Washington.
The data for each state is as follows:
| Rank | State | Largest Agriculture Type (by $) | Annual Output |
| #1 | California | Fruit, tree nuts, and berries | $17,638,972,000 |
| #2 | Iowa | Grains, oilseeds, dry beans, and dry peas | $17,146,679,000 |
| #3 | Illinois | Grains, oilseeds, dry beans, and dry peas | $13,589,230,000 |
| #4 | Texas | Cattle and calves | $13,013,127,000 |
| #5 | Minnesota | Grains, oilseeds, dry beans, and dry peas | $12,304,415,000 |
| #6 | Nebraska | Grains, oilseeds, dry beans, and dry peas | $10,698,861,000 |
| #7 | Kansas | Cattle and calves | $10,153,087,000 |
| #8 | North Dakota | Grains, oilseeds, dry beans, and dry peas | $8,813,348,000 |
| #9 | Indiana | Grains, oilseeds, dry beans, and dry peas | $7,217,854,000 |
| #10 | Ohio | Grains, oilseeds, dry beans, and dry peas | $5,834,600,000 |
| #11 | South Dakota | Grains, oilseeds, dry beans, and dry peas | $5,809,792,000 |
| #12 | Wisconsin | Milk from cows | $4,952,039,000 |
| #13 | North Carolina | Poultry and eggs | $4,837,026,000 |
| #14 | Georgia | Poultry and eggs | $4,773,837,000 |
| #15 | Colorado | Cattle and calves | $4,321,308,000 |
| #16 | Arkansas | Grains, oilseeds, dry beans, and dry peas | $4,214,355,000 |
| #17 | Missouri | Grains, oilseeds, dry beans, and dry peas | $3,922,873,000 |
| #18 | Alabama | Poultry and eggs | $3,624,852,000 |
| #19 | Michigan | Grains, oilseeds, dry beans, and dry peas | $3,613,250,000 |
| #20 | Oklahoma | Cattle and calves | $3,402,919,000 |
| #21 | Washington | Fruit, tree nuts, and berries | $2,931,370,000 |
| #22 | Mississippi | Poultry and eggs | $2,744,048,000 |
| #23 | New York | Milk from cows | $2,417,398,000 |
| #24 | Idaho | Milk from cows | $2,333,364,000 |
| #25 | Pennsylvania | Milk from cows | $1,966,892,000 |
| #26 | Florida | Fruit, tree nuts, and berries | $1,847,805,000 |
| #27 | Louisiana | Grains, oilseeds, dry beans, and dry peas | $1,832,208,000 |
| #28 | Montana | Grains, oilseeds, dry beans, and dry peas | $1,787,162,000 |
| #29 | Kentucky | Grains, oilseeds, dry beans, and dry peas | $1,656,983,000 |
| #30 | South Carolina | Poultry and eggs | $1,476,817,000 |
| #31 | Tennessee | Grains, oilseeds, dry beans, and dry peas | $1,301,303,000 |
| #32 | New Mexico | Milk from cows | $1,251,065,000 |
| #33 | Virginia | Poultry and eggs | $1,161,564,000 |
| #34 | Wyoming | Cattle and calves | $1,101,195,000 |
| #35 | Maryland | Poultry and eggs | $922,999,000 |
| #36 | Oregon | Cattle and calves | $894,485,000 |
| #37 | Delaware | Poultry and eggs | $811,301,000 |
| #38 | Arizona | Vegetables, melons, potatoes and sweet potatoes | $764,062,000 |
| #39 | Vermont | Milk from cows | $504,884,000 |
| #40 | New Jersey | Nursery, greenhouse, floriculture and sod | $405,247,000 |
If you would like to be updated via email when we post a new article, please click here. It’s free and we won’t send any promotional materials.
Would you like to be notified when we publish a new article on The Sounding Line? Click here to subscribe for free.

