Submitted by Taps Coogan on the 2nd of January 2020 to The Sounding Line.
Enjoy The Sounding Line? Click here to subscribe for free.
Enjoy The Sounding Line? Click here to subscribe.
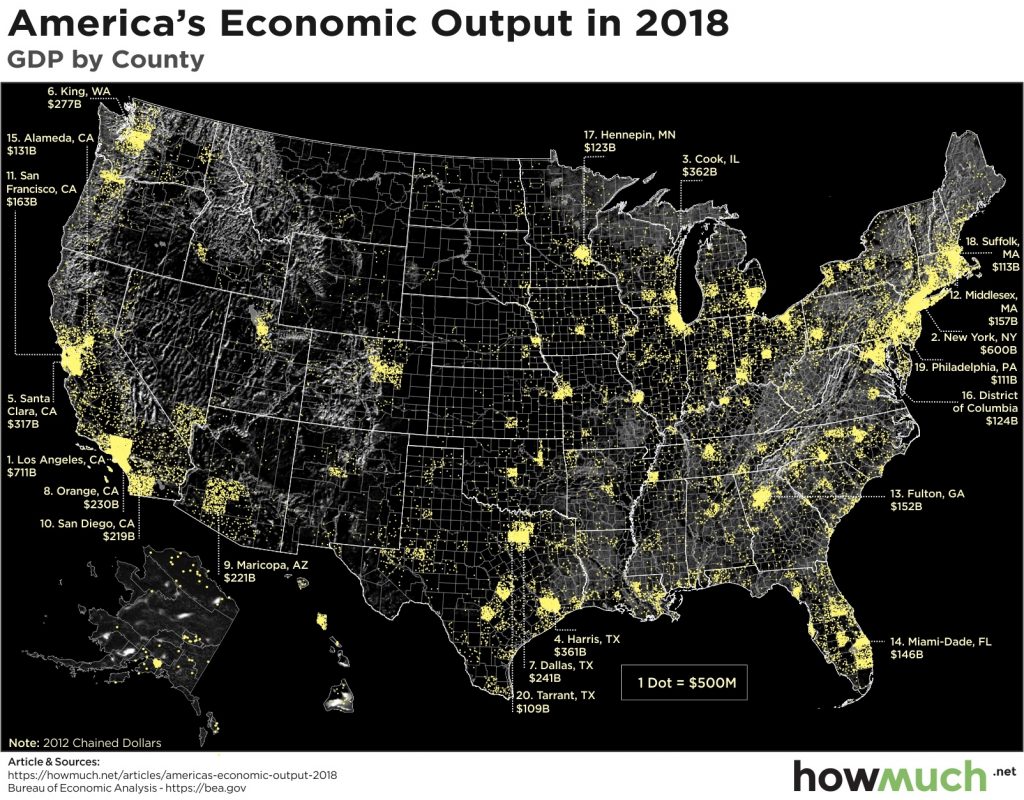
We talk quite a lot about the US economy as a homogeneous unit here at The Sounding Line. The following map, from HowMuch.net, is a reminder that the US economy is really an amalgamation of regional economies and the map reveals exactly where those economies are. Every yellow dot represents $500 billion inflation adjusted dollars of GDP (2012 chained dollars).

The largest state economies in the US are California (14.6% of US GDP), Texas (9.2%), and New York (7.7%). Together, those three states make up nearly a third of US GDP. The top ten states are as follows:
Ten Largest State Economies:
- California – 14.6%
- Texas – 9.2%
- New York – 7.7%
- Florida – 5.0%
- Illinois – 4.1%
- Pennsylvania – 3.8%
- Ohio – 3.2%
- New Jersey – 3.0%
- Georgia – 2.8%
- Washington – 2.7%
The largest county economies in the US are as follows:
Ten Largest County Economies:
- Los Angeles, California – 3.8%
- New York, New York – 3.2%
- Cook, Illinois – 1.9%
- Harris, Texas – 1.9%
- Santa Clara, California – 1.7%
- King, Washington – 1.5%
- Dallas, Texas – 1.3%
- Orange Country, California – 1.2%
- Maricopa, Arizona – 1.2%
- San Diego, California – 1.2%
Not too surprisingly, the counties that seat Los Angeles, New York City, and Chicago (Cook County), have the largest economies in the county. To be fair, Los Angeles county is physically a very large county, encompassing more land than the States of Rhode Island or Delaware and about 100 times more land than New York, New York.
Regionally, most of the US economy remains east of the Mississippi river or on the West Coast.
Would you like to be notified when we publish a new article on The Sounding Line? Click here to subscribe for free.
Would you like to be notified when we publish a new article on The Sounding Line? Click here to subscribe for free.

