Submitted by Taps Coogan on the 4th of April 2017 to The Sounding Line.
Enjoy The Sounding Line? Click here to subscribe for free.
As we have documented in articles in the ‘Top News’ Column here at The Sounding Line, margin debt on the New York Stock Exchange (NYSE) has just set an all-time high of over $500 billion. This has led many forecasters to the conclusion that the US stock market bubble risks imploding.
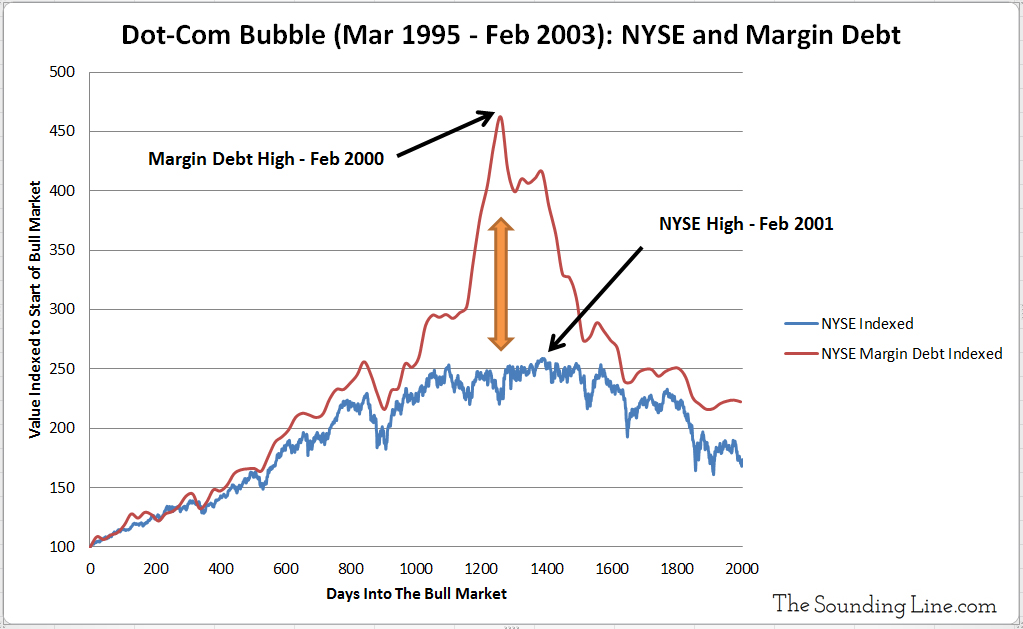
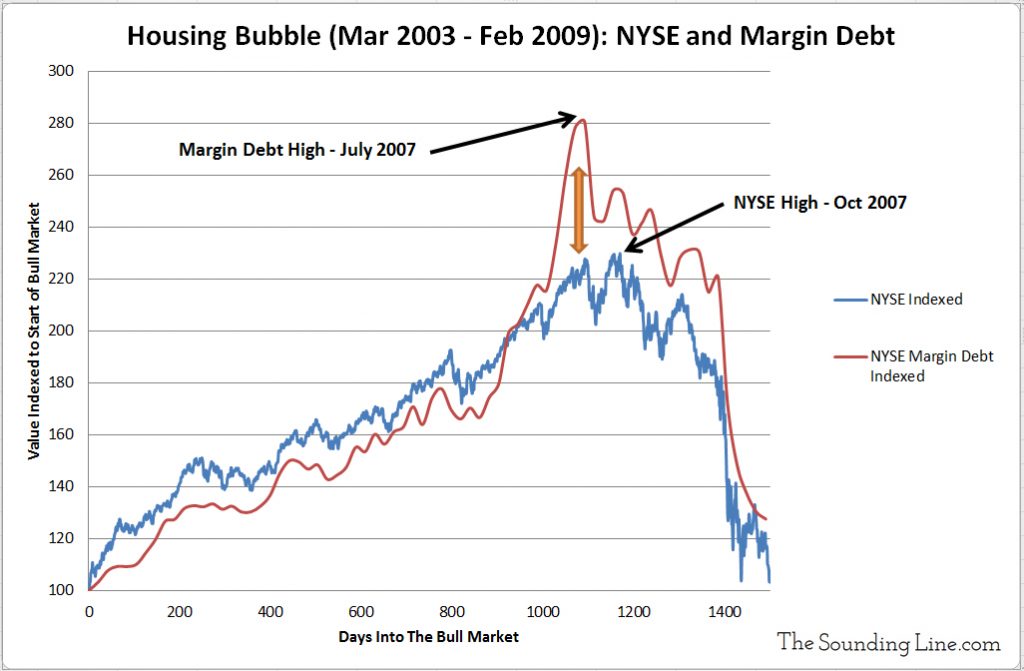
In order to put $500 billion of margin debt into context, the following charts show the NYSE index and margin debt during the dot-com and housing bubbles. The NYSE and the amount of margin debt are indexed to the start of each bull market.
The key take away from the two charts below is this: margin debt peaked one year before the high on the NYSE during the dot-com bubble and four months before the high during the housing bubble. In both cases, margin debt growth closely matched growth on the NYSE for most of the bull market and then, near the highs, margin sharply outgrew the NYSE, peaked, and the market subsequently collapsed.


Psychologically this pattern is revealing. At the start of a bull market the last bear market is fresh in investors’ minds and buying on margin is kept moderated. Margin growth approximates that of market prices. But, as the bull market stretches on for years, memories of the last crash fade (or investors are too young to have experienced one), bears throw in the towel, and investors downplay the risks of excessive margin. In the final throws of the bull market, margin growth surges faster than market price gains. These exuberant gains in margin keep the market rising beyond prices that can be supported in the absence of that very margin. This creates a literally unsustainable situation where margin grows faster than prices, which are held up by largely margin. When margin growth inevitably stalls, so does the market. Thus a trigger is set and once the market declines even modestly, the overhang of margin becomes a weight that pulls everything down.
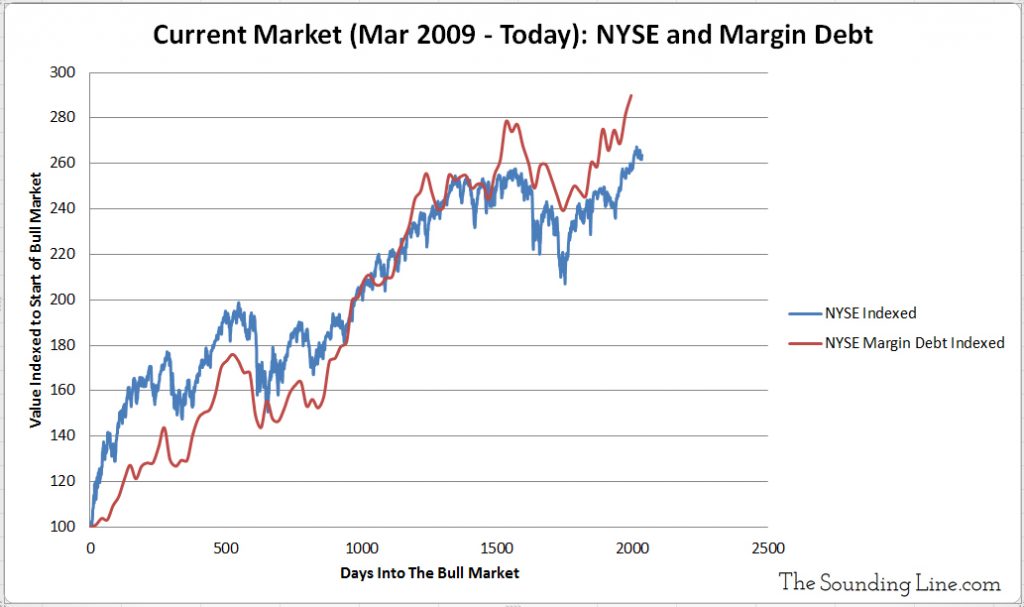
So where are we now?
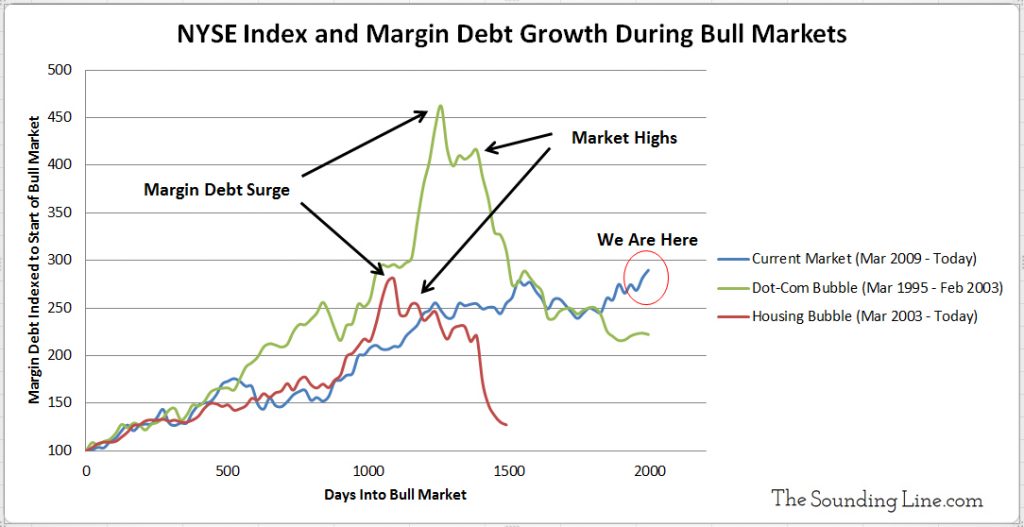
As the following chart shows, for the current bull market (shall we call it the low interest rate bubble?) margin debt growth is now modestly outpacing NYSE price growth. However, the type of margin debt surge that preceded the 2001 and 2007 market highs has yet to occur. While the current margin debt growth is unsustainable and caution is increasingly warranted, it doesn’t appear from this metric that the market is in its absolute final throws. Nonetheless, caution is the key word from here on out and investors should keep a key eye on this metric.

One final chart to compare the margin debt growth during the three bull markets:

P.S. We have added email distribution for The Sounding Line. If you would like to be updated via email when we post a new article, please click here. It’s free and we won’t send any promotional materials.
Would you like to be notified when we publish a new article on The Sounding Line? Click here to subscribe for free.

