Taps Coogan – July 23rd, 2021
Enjoy The Sounding Line? Click here to subscribe for free.
Enjoy The Sounding Line? Click here to subscribe.
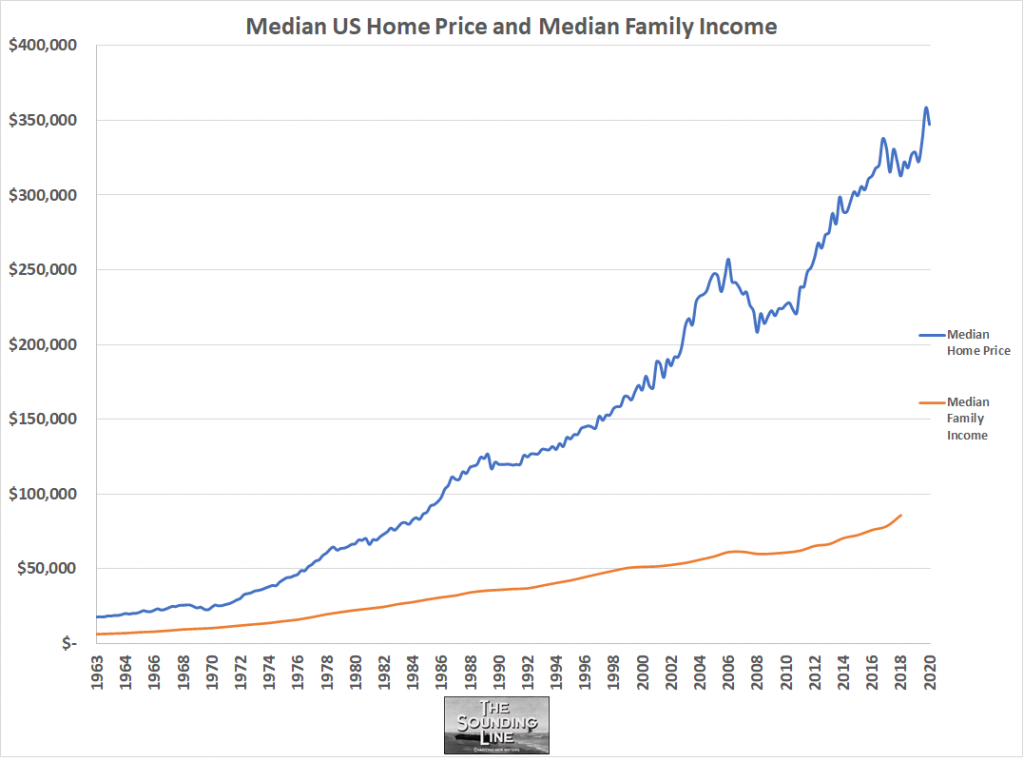
Back in 2017, we published this article, comparing median home prices to median family income. The punchline of the article was that the cost of a median home had risen from just 2.4 years of median family income in 1970, to 4.3 years in 2016.
A reader recently asked if I could update the chart comparing median home price and family income with the most recent figures, so here you go.

The ratio remains around four years of work, however, it’s important to note that the current median family income data only goes to 2019, a year that saw a historic jump in family income, which predates the ongoing outburst of collective madness. So, we’ll have to wait and see just how much of a jump in household income the stimulus money caused in 2020 and 2021 versus the historic jump in home prices.
Either way, the massive gap that has opened up since the 1960s is unlikely to close anytime soon and, in all likelihood, is still widening. Perhaps in some distant future, policy makers will realize that asset price appreciation in advance of earnings and economic growth is not actually a good thing for normal people, and is especially bad for young families, but this is certainly not that time.
Would you like to be notified when we publish a new article on The Sounding Line? Click here to subscribe for free.
Would you like to be notified when we publish a new article on The Sounding Line? Click here to subscribe for free.

