Taps Coogan – September 3rd, 2021
Enjoy The Sounding Line? Click here to subscribe for free.
Enjoy The Sounding Line? Click here to subscribe for free.
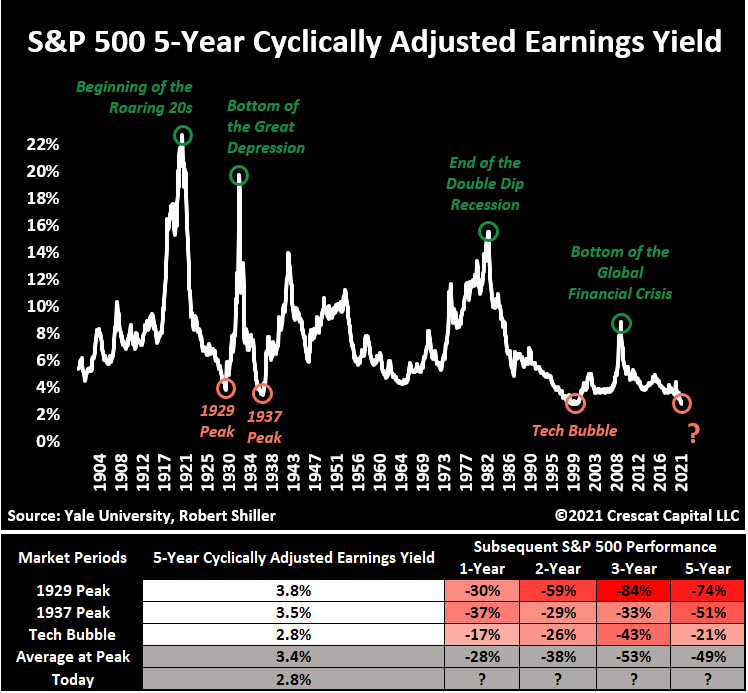
Add the following chart, from Crescat Capital’s Otavio Costa, to the pile of charts that show that we are currently witnessing the most expensive market in recorded American history.

The cyclically adjusted earnings yield of the S&P 500 is the prior ten years of earnings adjusted for inflation as a percent of the S&P 500. It is now at its lowest level in well over 120 years, taking out the lows made in 1929 & 1937 and matching the low made during the Dot-Com bubble.
What’s the historic range of 3-year performance of the S&P 500 from a yield at these rough levels? Somewhere between negative 84% and negative 33%.
Of course, there are only a few data points near these lows, QE hadn’t been invented for the prior examples, and policy makers hadn’t fully embraced moral hazard. So, who knows how much longer this will go on for?
Would you like to be notified when we publish a new article on The Sounding Line? Click here to subscribe for free.
Would you like to be notified when we publish a new article on The Sounding Line? Click here to subscribe for free.

