Taps Coogan – August 31st, 2021
Enjoy The Sounding Line? Click here to subscribe for free.
Enjoy The Sounding Line? Click here to subscribe.
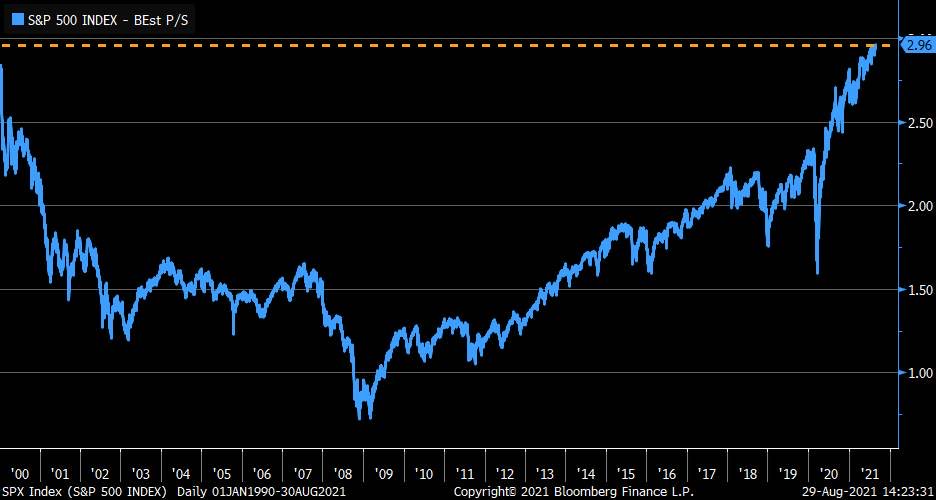
Back in July, we noted that the at the S&P 500 price to sales ratio had surged to double the long term average and a new all time high.
Today, as the following chart from Charles Schwab Chief Investment Strategist Liz Ann Sonders highlights, the S&P 500 forward price-to-sales ratio has now taken out the Dot-Com Bubble high to reach the highest level ever witnessed.

To be clear about what this means, whereas the S&P 500 has been at record expensive levels relative to current sales since the middle of last year, investors are now paying more for forecasted sales than they were at the peak of the Dot-Com Bubble. The Dot-Com bubble is widely considered to have been the most capriciously over-valued moment in American stock market history, along with 1929.
It’s getting pretty hard to think of a definition for a financial bubble that the current moment doesn’t meet, though that will apparently come as a great surprise to the Fed. It truly is impossible for this Fed to spot bubbles, though the ignorance is entirely willful.
Would you like to be notified when we publish a new article on The Sounding Line? Click here to subscribe for free.
Would you like to be notified when we publish a new article on The Sounding Line? Click here to subscribe for free.

