Submitted by Taps Coogan on the 18th of January 2019 to The Sounding Line.
Enjoy The Sounding Line? Click here to subscribe for free.
Virtually everyone acknowledges that Chinese GDP numbers are fabricated. Not only do Chinese economic planners use various strategies to game GDP calculation inputs in order to meet Communist Party growth targets, even those exaggerated inputs are rolled up into overall numbers that literally don’t add up in the most obvious of ways. The phenomenon has been documented countless times by countless sources (here, here, here, here, here, here, etc…). Even the Chinese government has admitted to it in their own way. While estimates of China’s real GDP growth rate vary widely, they are typically at least a couple of percentage points lower than the official Chinese number.
When the Chinese economy was growing at an official rate of over 14% in 2007, arguing that it was really only growing at 11% was a waste of time. It might have been true, but it missed the point that China’s economy was growing very fast, several times faster than the US and other developed countries.
Fast forward to today and China’s official GDP numbers show it growing at roughly 6.6%. With many major economic indicators slowing or in outright contraction (auto sales, PMI, consumer spending, rising unemployment…), estimates of China’s real GDP growth in 2018 have ranged from 5% to as little as 1.67%.
All of a sudden the difference between China’s official GDP number and the real number matters a lot. Not only is there a world of difference for China’s economy between 3% and 6% growth, the entire narrative of China’s economic rise is predicated on it overtaking the roughly 50% larger US economy.
The US economy grew at roughly 3% in 2018. For the first time in many decades, the US economy may have grown roughly as fast as the Chinese economy, maybe even a bit faster. The convergence didn’t happen due to a recession or some other extenuating circumstance. It happened during a year that roughly reflects expectations for the future. The convergence is not a fluke.
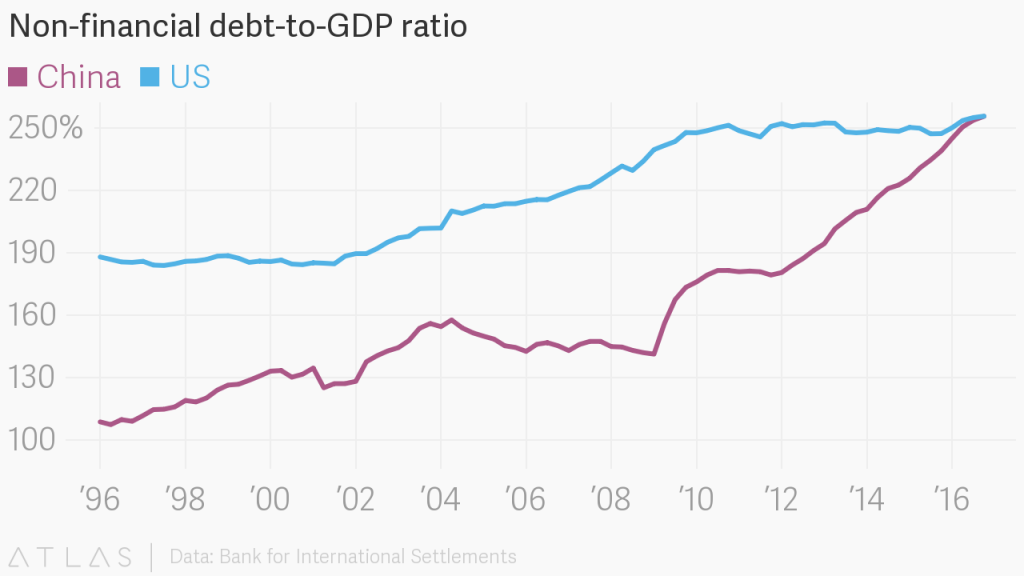
Meanwhile, Chinese non-financial debt-to-GDP overtook the US back in 2016. Since then it has only increased.

Even Chinese government borrowing is catching up to the US’s gargantuan government deficits. By our calculations, total government borrowing in China (including local governments) was roughly 5.7% of GDP in 2017, the most recent date for which relativity complete data is available. However, due to the China’s rampant shadow banking system and morass of government owned ‘zombie’ companies, the true increase in Chinese government debt is likely meaningfully higher than the reported figures. As the IMF has repeatedly warned: “China’s official government accounts do not capture a large amount of fiscal spending delivered through off-budget units.” The result is potentially billions of dollars of spending and debt that don’t get counted in China’s ‘official’ government debt figures.
Forecasts for total US government borrowing in 2019 (including state and local) point to 6.1% of GDP in 2019, though the true number is always higher. Relative to GDP, China’s rate of total government borrowing is only a bit behind the US.
Keep in mind that with all of these debt-to-GDP comparisons, Chinese GDP is inflated and Chinese debt is understated.
Whether or not China is outgrowing the US, and whether or not it is more indebted than the US, is a debate that reasonable people can have for the first time in decades.
If that doesn’t mark the end of the Chinese ‘economic miracle,’ I don’t know what would.
P.S. If you would like to be updated via email when we post a new article, please click here. It’s free and we won’t send any promotional materials.
Would you like to be notified when we publish a new article on The Sounding Line? Click here to subscribe for free.

