Taps Coogan – October 3rd, 2021
Enjoy The Sounding Line? Click here to subscribe for free.
Enjoy The Sounding Line? Click here to subscribe.
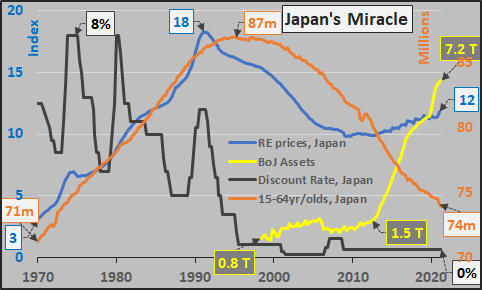
The following chart, from Economica’s Chris Hamilton, captures the economic story of our era in its purest form: the demography and monetary policy of Japan over the last few decades.

Japan’s real-estate bubble peaked in the early 1990s, a few years before its working age population peaked. In response, the Bank of Japan (BoJ) began to aggressively cut interest rates in the mid 1990s, which did little to halt the decline in real estate values (and other financial assets). Only when the BoJ launched its massive QE in the early 2010s did real-estate (and other financial assets) start to really recover, despite a continued decline in population. Declining demographics are the key to understanding the current era of endless accommodative policy and asset price inflation.
For those that are wondering, the Eurozone working age population peaked about a decade after Japan (around 2009) leading to a near verbatim policy response. The US working age population is peaking now. A degree of tapering aside, QE isn’t going anywhere.
Would you like to be notified when we publish a new article on The Sounding Line? Click here to subscribe for free.
Would you like to be notified when we publish a new article on The Sounding Line? Click here to subscribe for free.

