Taps Coogan – February 6th, 2022
Enjoy The Sounding Line? Click here to subscribe for free.
Enjoy The Sounding Line? Click here to subscribe for free.
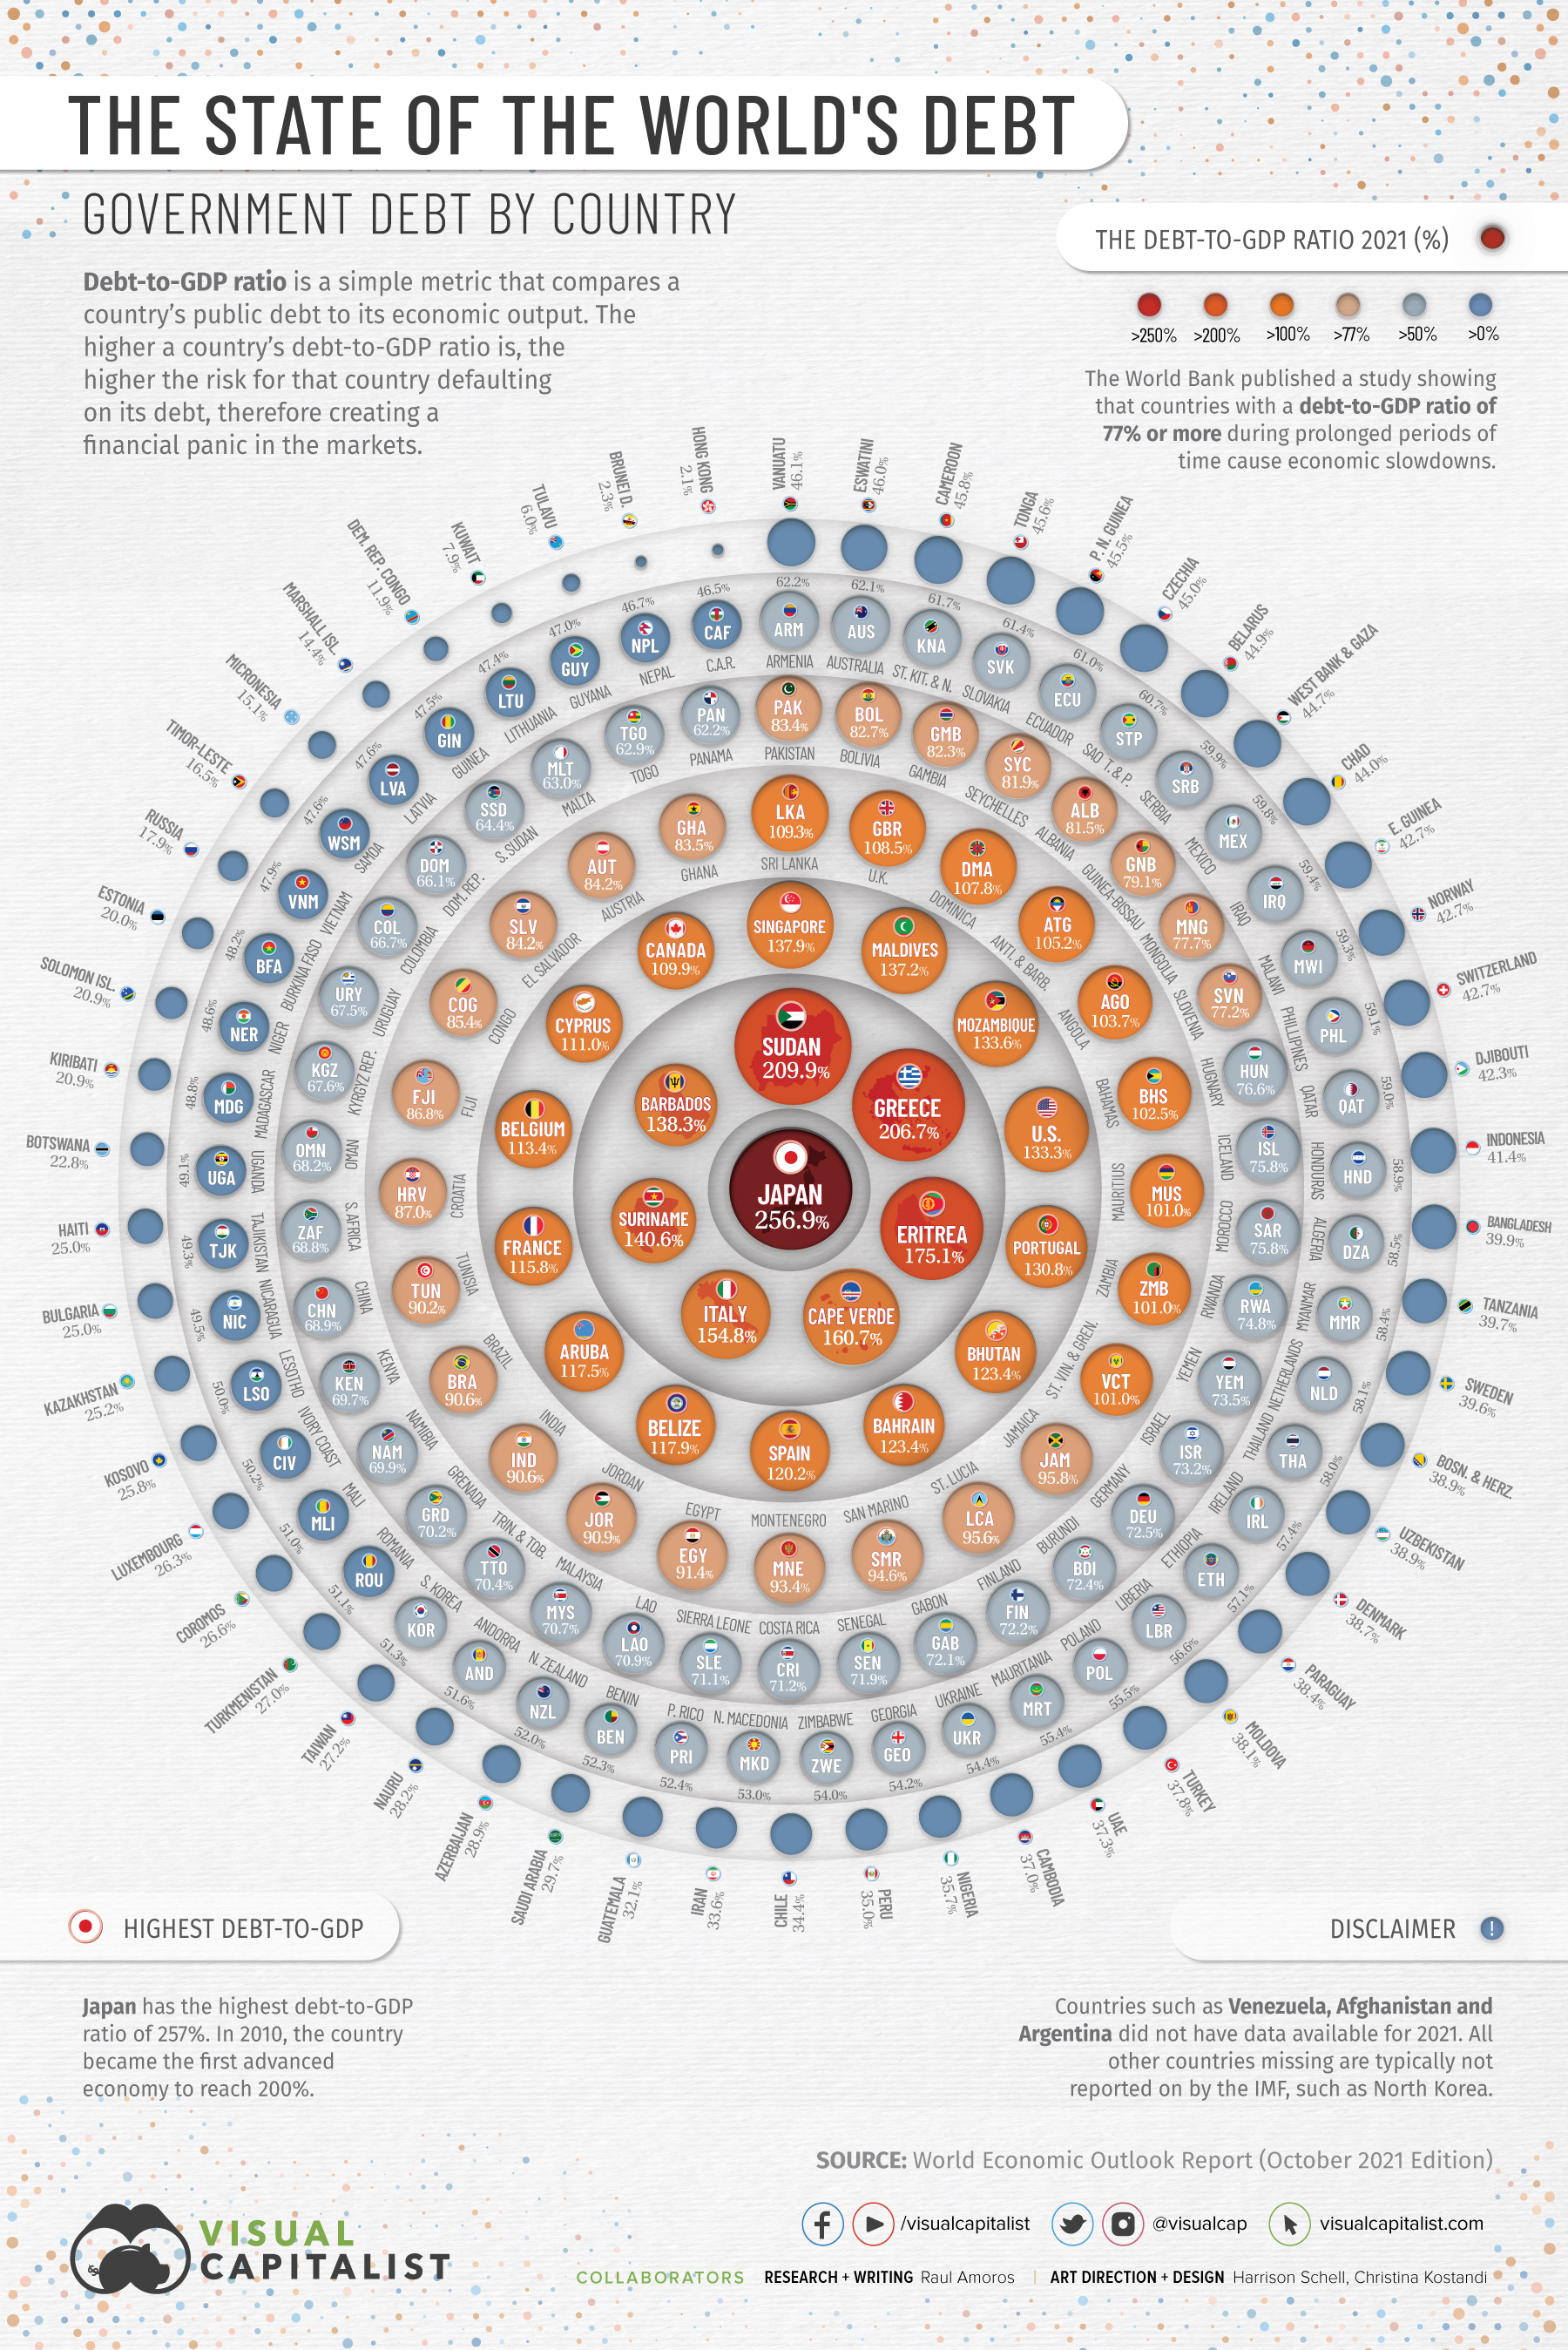
The following chart, from Visual Capitalist, highlights the current state of government debt-to-GDP around the world as it marches inexorably higher.
Having written about this subject for years, it suffices to say that whatever trajectory of increasing debt levels is currently forecast in the US, Western Europe, Japan etc… the reality will be worse as people endlessly demand that their governments throw ever larger amounts of money and economy-killing regulations at whatever the political crisis of the day is.

Would you like to be notified when we publish a new article on The Sounding Line? Click here to subscribe for free.
Would you like to be notified when we publish a new article on The Sounding Line? Click here to subscribe for free.


The country’s debt levels stabilized for several years before accelerating again to reach an all-time high of nearly 290% of gross domestic product in the third quarter last year, data by the Bank of International Settlements showed.
https://www.cnbc.com/2021/06/29/china-economy-charts-show-how-much-debt-has-grown.html