Submitted by Taps Coogan on the 29th of March 2019 to The Sounding Line.
Enjoy The Sounding Line? Click here to subscribe for free.
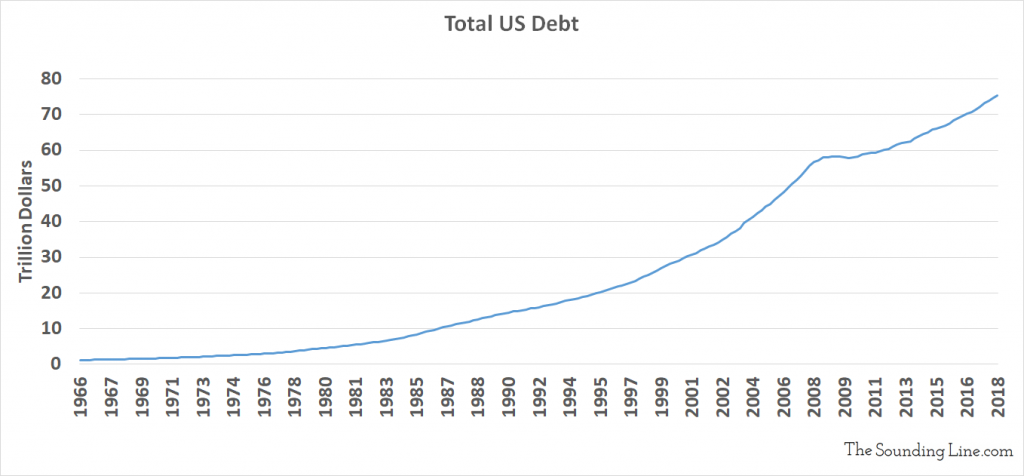
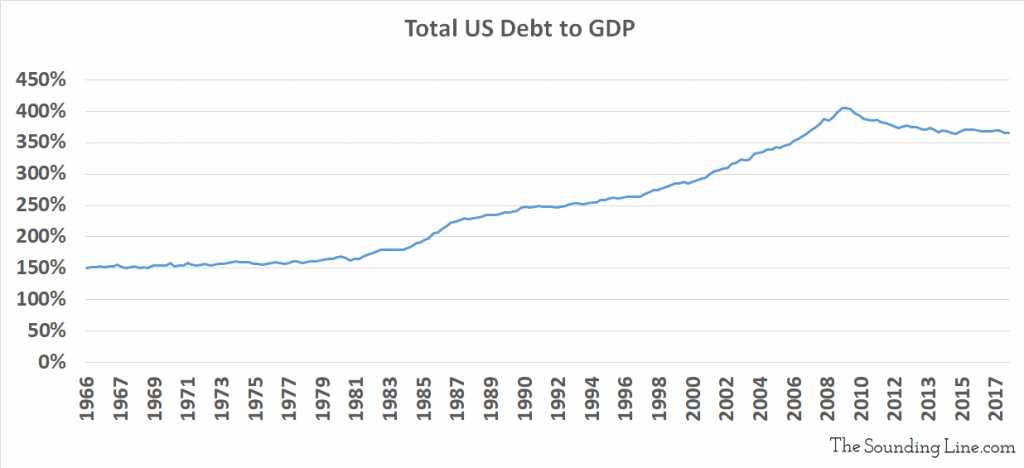
Based on the latest data from Q3 2018, total private and public US debt has hit an all time record-high of $75.3 trillion, or a staggering 365% of GDP.

The total debt figure is based on the Fed’s Financial Account of the US and includes:
- Open market paper
- Treasury securities
- Agency and GSE-backed securities
- Municipal securities
- Corporate and foreign bonds held in the US
- Depository institution loans
- Other loans and advances
- Mortgages
- Consumer credit including: student debt, revolving credit, credit card debt, auto debt, and anything else categorized as consumer credit
The Fed’s measure of outstanding US treasuries appears to not count certain types of intra-governmental debt holdings as it is consistently lower than the national debt. Therefore, I have added the difference between the national debt and the Fed’s estimation of outstanding treasuries to try and capture the difference. As a result, my estimation of total US debt is higher than some others that you may find.
When it comes to total debt in the US, there is some good news. Although the dollar value of the total debt continues to climb, the debt level has shrunk from 405% of GDP in 2008 to 365% in Q3 2018.

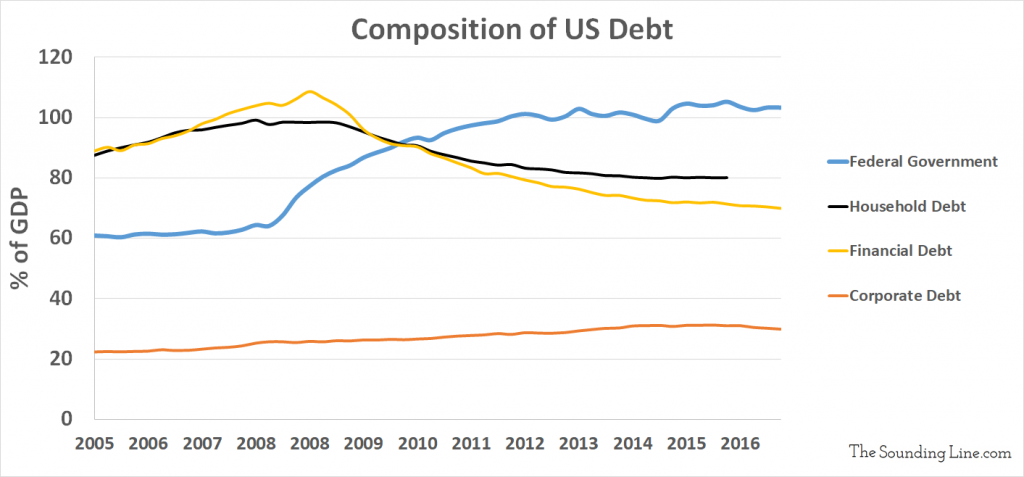
The modest decline in the total debt-to-GDP since 2008/2009 is a result of a decrease in household debt relative to the economy, as we discussed here, as well as a decline in financial debt. The following chart shows the main components of total US debt. While household and corporate debt-to-GDP has declined, government debt and corporate debt have risen. Corporate debt, while the smallest of the four, is well above its Financial Crisis levels.

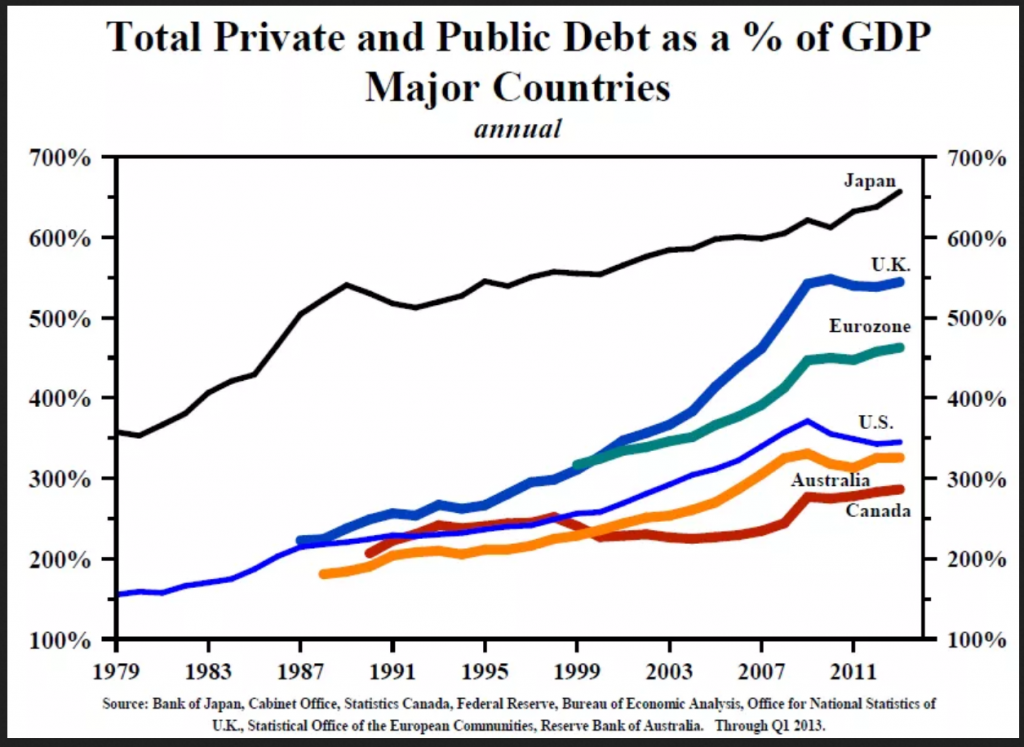
The following chart from Compass shows that US debt levels are actually lower than some other notable developed economies including: Japan, the UK, and the Eurozone. The total US debt level is also likely below China’s.

Virtually all developed economies, and most developing economies, are now grossly over-indebted. In absolute terms, the US is the most indebted economy in the world and the US Federal government is the most indebted single entity. Nonetheless, relative to its economy, the US has actually very modestly deleveraged since the Financial Crisis and, while certain sub-sectors like the federal government and corporate debt are highly concerning, holistically the US is not the most glaring debt bubble economy in the world.
Would you like to be notified when we publish a new article on The Sounding Line? Click here to subscribe for free.


CAn you chart China too? Or is it too hard with SOE debt?
I would love to. I have been trying to track down quality data on Chinese debt, particularly government debt, and particularly off-balance sheet and SOE debt for a long time. If any reader knows where I could find such data, please let me know. What seems to be the case is that the official numbers for China are next to useless under-estimations. While not a total debt-top-GDP figure, the number that sticks in my head is that China runs a 10% fiscal deficit. That’s twice as big as the US even after the budget was blown out in 2018. Imagine… Read more »
Seriously? I would trust no data out of China, the accounting practices there amount to tell the government what they tell you to say!