Submitted by Taps Coogan on the 26th of March 2019 to The Sounding Line.
Enjoy The Sounding Line? Click here to subscribe for free.
Enjoy The Sounding Line? Click here to subscribe.
As has been widely reported, there was a major inversion of part of the US Treasury yield curve on the 22nd of March 2019, as the 3-month yield rose above the 10-year yield for the first time since the Financial Crisis. The 3-month to 10-year spread is generally considered to be the most reliable yield spread at predicting recessions, though the difference between it and other popular yield spreads is minor.
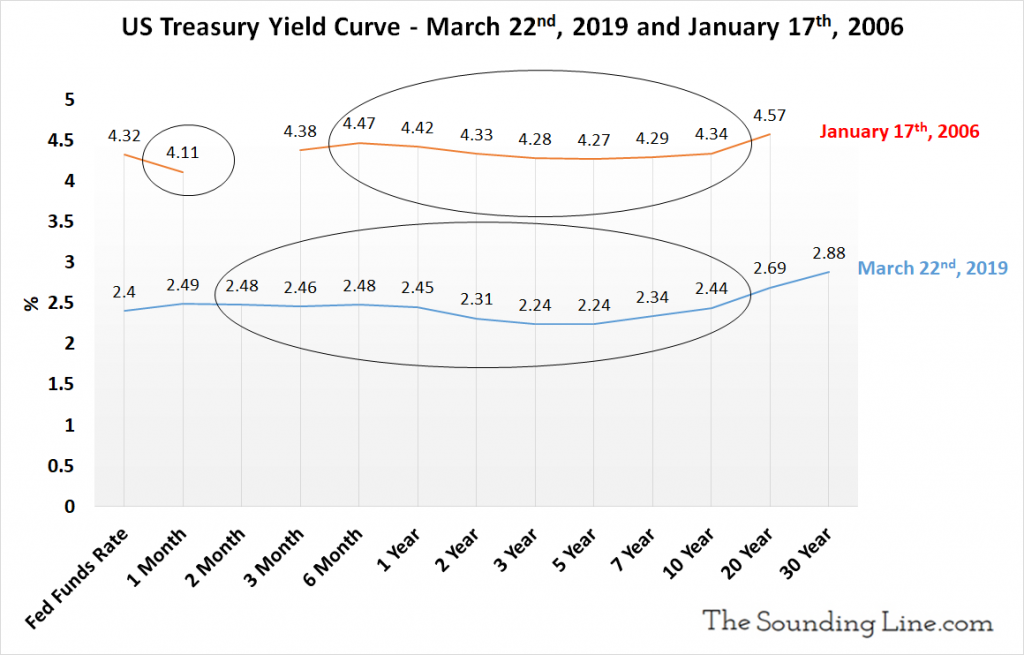
The following chart compares the Treasury yield curve on March 22th, 2019 to the yield curve on January 17th, 2006 when the 3-month to 10-year spread inverted for the first time leading up to the Financial Crisis:

The 2-month and 30-year data are missing from the 2006 yield curve because the 2-month treasury bill had not yet been created and the 30-year was not being issued at the time. Besides the fact that interest rates were a couple percent higher in 2006, the shapes of the curves are remarkably similar.
The following parts of the yield curve are currently inverted:
-
- Fed Funds to 2-year, 3-year, 5-year, 7-year
- 1-month to 2-month, 3-month, 6-month, 1-year, 2-year, 3-year, 5-year, 7-year, 10-year
- 2-month to 3-month, 1-year, 2-year, 3-year, 5-year, 7-year, 10-year
- 3-month to 1-year, 2-year, 3-year, 5-year, 7-year, 10-year
- 6-month to 1-year, 2-year, 3-year, 5-year, 7-year, 10-year
- 1-year to 2-year, 3-year, 5-year, 7-year, 10-year
- 2-year to 3-year, 5-year
That makes a total of 39 inversion combinations on the current yield curve. There are 32 if you exclude the 2-month and 30-year treasuries, which were not in the corresponding data from 2006.
On January 17th 2006, the following parts of the yield curve were inverted:
-
- Fed Funds to 1-month, 2-year, 3-year, 5-year, 7-year
- 3-month to 2-year, 3-year, 5-year, 7-year, 10-year
- 6-month to 1-year, 2-year, 3-year, 5-year, 7-year, 10-year
- 1-year to 2-year, 3-year, 5-year, 7-year, 10-year
- 2-year to 3-year, 5-year, 7-year
- 3-year to 5-year
That makes 25 inversion combinations on the yield curve when the 3-month to 10-year spread first inverted before the Financial Crisis on January. In other words, more parts of the yield curve are inverted today than when the same indicator first signaled recession in the run-up to the Financial Crisis.
A 3-month to 10-year spread inversion has proceeded every recession since 1957 by an average of roughly one year, and has only given one false positive (in 1966). Some, including the Fed, have argued that this time is different because the large growth in central bank balance sheets since the Financial crisis has artificially suppressed longer term interest rates, making the yield curve less meaningful.
In 2006, most economists, including the Fed, made essentially the same argument, except they blamed a ‘foreign savings glut’ and overly tight short term rates for causing the same phenomenon.
Reading articles from 2006 is like deja-vu. This MarketWatch article from 2006 noted:
“Other economists say the curve has lost its significance because special factors, such as the government shifting issuance to shorter maturities and strong demand for Treasurys from foreign buyers, have distorted the curve’s economic signals…
“A flattening of the yield curve is not a foolproof indicator of future weakness,” Fed Chairman Alan Greenspan told lawmakers recently. He argued that several factors influence the shape of the yield curve, including expectations about monetary policy, inflation, risk and growth…”
In 2006, the Financial Times wrote this shortly after the yield curve inverted:
“There is however a school of thinking that includes Alan Greenspan, chairman of the Federal Reserve, who believe that this inversion is a false recession indicator, since long-term yields are being held down by heavy investor demand, particularly from pension fund managers, rather than macro-economic bets.
”Then again, we said the same thing in 2000 [the last curve inversion] – that the inversion was the result of scarcity value at the long end of the curve to do with Treasury buybacks,” noted Gerald Lucas, trading strategist at Bank of America. “We’re going to see slower growth late this year, but the key thing is whether we see a revival after that.”
Shortly after the 2000 inversion, the bursting of the dotcom bubble pushed the economy into recession.”
It is worth noting that, more often than not, the stock market rallies in the months immediately following yield curve inversions.
Every time the yield curve inverts there is a theory about why it doesn’t matter. The stock market rallies that often follow inversions further allay fears that it really is ‘different this time.’ In the end, it almost always ends up not being different.
If you would like to be updated via email when we post a new article, please click here. It’s free and we won’t send any promotional materials.
Would you like to be notified when we publish a new article on The Sounding Line? Click here to subscribe for free.


When I feel down here is were i go : https://www.youtube.com/watch?v=xnP396-1U0s
nice
Nice research, now where were we last time when we had 32 inversions? 😉
Good question 🙂
Coincidences
Nothing else
Yield curves have no significance
Wow! I never thought about it like that. Really compelling argument!
…