Taps Coogan – June 10th, 2021
Enjoy The Sounding Line? Click here to subscribe for free.
Enjoy The Sounding Line? Click here to subscribe.
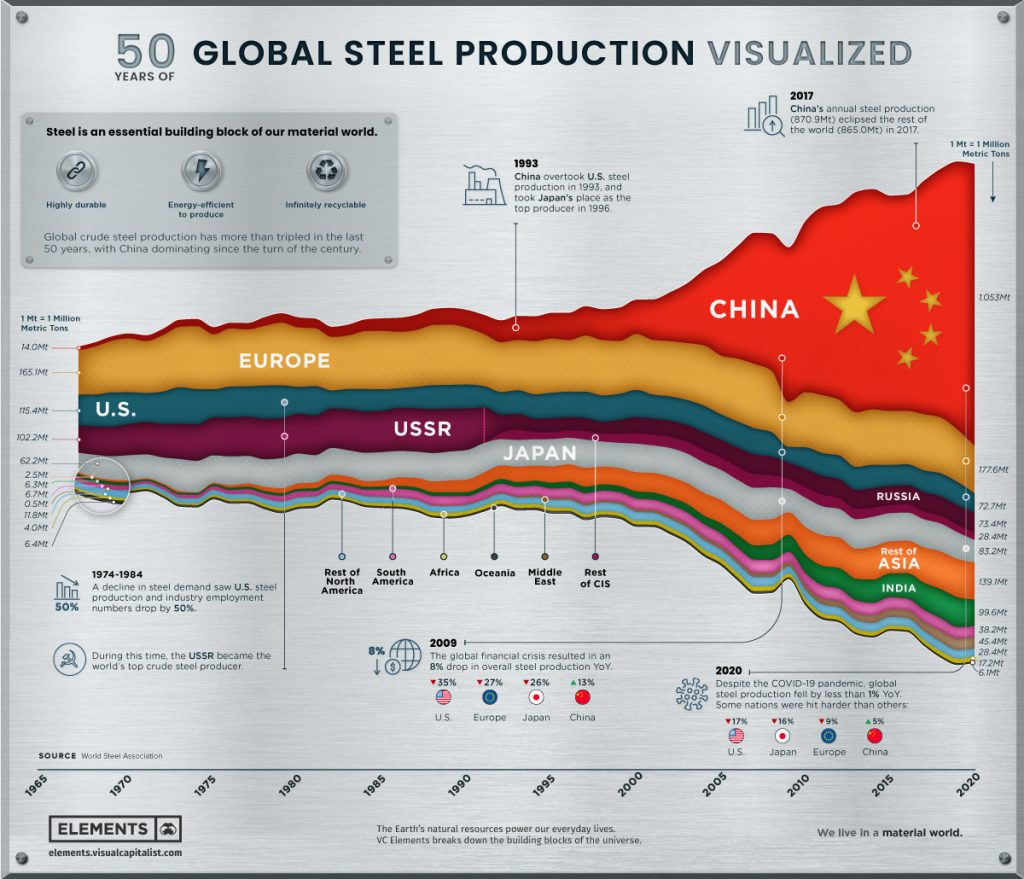
The following chart, from Visual Capitalist, details global steel production since the mid 1960s based on data from the World Steel Association.

Over the past 50 years, global steel production has more than tripled, reaching 1,864 million metric tons of crude steel output in 2020 and making steal the world’s most utilized metal and most recycled material.
Despite the surge in global steel production since the 1960s, US European, Soviet/Russian, and Japanese steel output has all shrunk. Virtually all global growth has come from China with smaller gains seen in India and the rest of Asia.
The following table summarizes the output by country in 2020.
| Rank | Country | Steel Production (2020, Mt) |
|---|---|---|
| #1 | China | 1,053.0 |
| #2 | India | 99.6 |
| #3 | Japan | 83.2 |
| #4 | Russia* | 73.4 |
| #5 | United States | 72.7 |
| #6 | South Korea | 67.1 |
| #7 | Turkey | 35.8 |
| #8 | Germany | 35.7 |
| #9 | Brazil | 31.0 |
| #10 | Iran* | 29.0 |
Source: World Steel Association. *Estimates.
More than half of global steel production now comes from China.
Meanwhile, US steel production has nearly halved since the 1970s due to uncompetitive energy costs, environmental regulations, bad trade policy, and the economic listlessness that has progressively befallen the nation. While China has become the world’s largest steel exporter, the US has become its largest importer.
Speaking of which, yes, our ongoing tour of Rust-Belt cities will eventually be making stops in former steel and iron powerhouses Pittsburg and Cleveland, and yes, you can probably guess what that will look like.
Would you like to be notified when we publish a new article on The Sounding Line? Click here to subscribe for free.
Would you like to be notified when we publish a new article on The Sounding Line? Click here to subscribe for free.

