Taps Coogan – October 28th, 2022
Enjoy The Sounding Line? Click here to subscribe for free.
Enjoy The Sounding Line? Click here to subscribe for free.
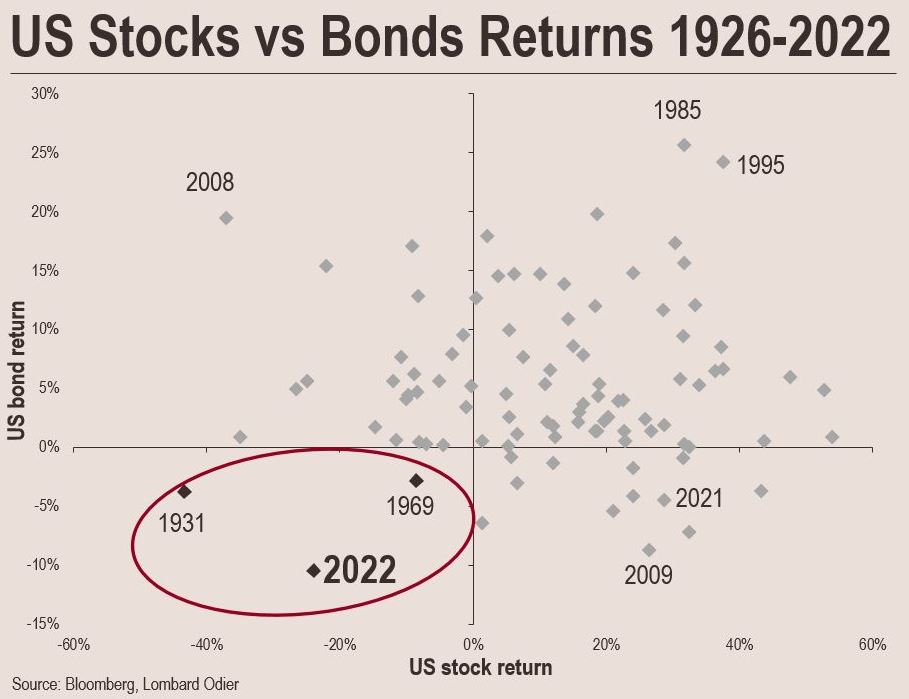
The following chart, from Lombard Odier, shows annual stock and bond returns every year since 1926.

The exact indexes used for the performance in the chart above aren’t noted. Most US bond indexes are down more than 10% year-to-date so I suspect that the bond returns are for the 10-year Treasury.
Regardless, the chart highlights that the combined stock and bond performance this year is among the worst ever and one of only three years since 1926 when both stock and bond returns (presumably Treasuries) have been negative. Not even in 1929 or 2008 were combined returns this bad.
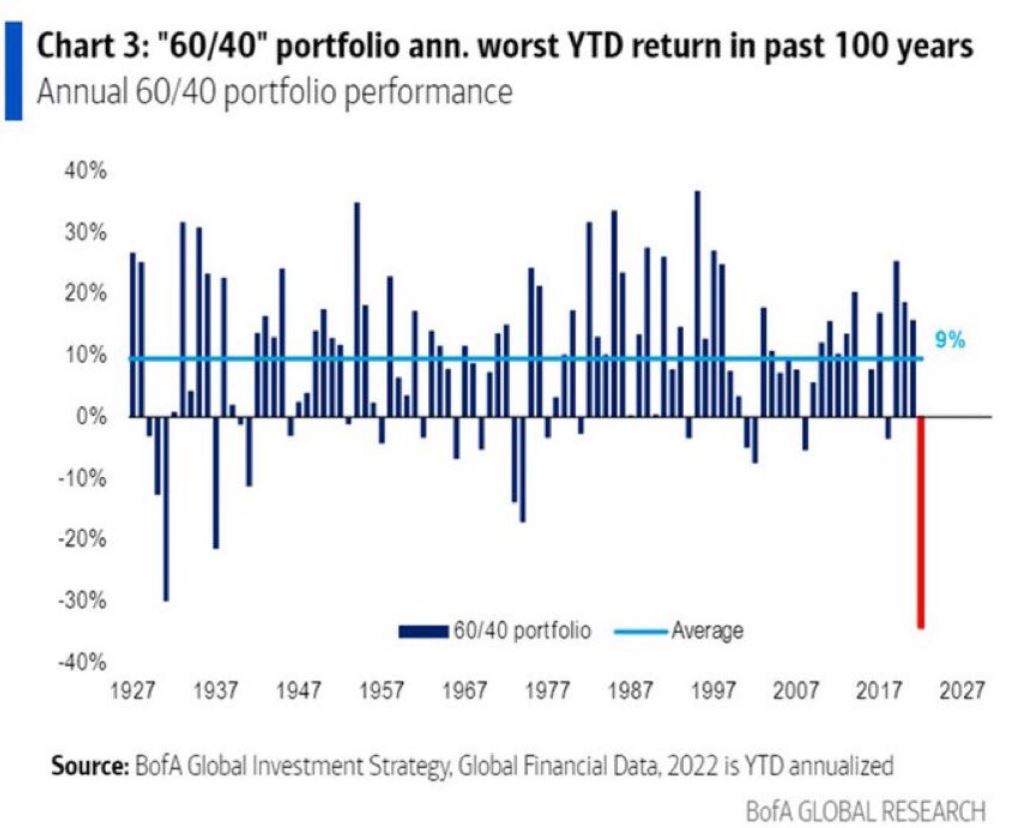
Indeed, as the following chart from Bank of America highlights, the generic 60/40 stock-bond portfolio has had its worst year in the last 100.

While the S&P 500’s maximum decline this year of about 27% corresponds to the sort of decline one would expect from a mild-to-moderate recession, the very large combined decline between stocks and bonds suggests that quite a bit of ‘recession’ may now be priced in, offering a sliver of short-to-medium-term hope.
Ominously however, the other years with similarly large combined drawdowns (the late 1920s and late 1960s) portended decade-long periods of trouble for the economy. While there may be room for some short term bounce, I personally suspect that we have entered a ‘lost decade‘ similar to the 1930s or 1970s.
Would you like to be notified when we publish a new article on The Sounding Line? Click here to subscribe for free.
Would you like to be notified when we publish a new article on The Sounding Line? Click here to subscribe for free.

