Submitted by Taps Coogan on the 13th of March 2020 to The Sounding Line.
Enjoy The Sounding Line? Click here to subscribe for free.
Enjoy The Sounding Line? Click here to subscribe.
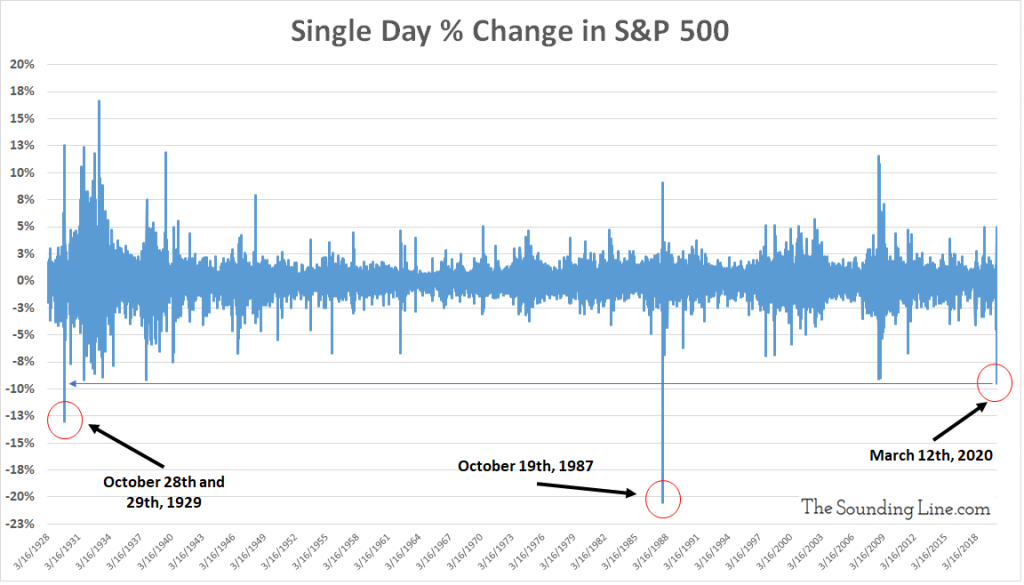
Yesterday’s selloff in the S&P 500, a whooping -9.4%, was the fourth largest single day percentage decline since at least 1928.

The only three days that were worse than yesterday’s selloff all have names. Two of them were Black Monday and Black Tuesday, October 28th and 29th of 1929. Those two days saw the S&P 500 plunge -12.94% and -10.16% respectively, kicking off the Great Depression.
The all time worst day for the S&P 500 was also called Black Monday, though this time referring to October 19th of 1987. It was the worst and final day of the 1987 Crash and pushed the S&P 500 down by 20.5%.
As we noted yesterday, the pace of the current selloff has been historic. The S&P 500 has plunged roughly 27% in just 16 days, worse than any 16 day period during the Global Financial Crisis, and only surpassed by the 1987 Crash and a few selloffs during the Great Depression.
It should be noted that following Black Tuesday of 1929, the S&P 500 rallied 12.54% and 5% over the following two days. It was quite a bounce but it didn’t change the fact that we were headed into a depression.
In the case of 1987, Black Monday was the low of the 1987 Crash and was followed by a 5.3% and a 9.1% bounce over the next two days. That bounce represented the start of a major bull market. Sometimes horrible days like yesterday are the start of a depression. Sometimes they are the end of a market crash. Either way, there tends to be a bounce of some sort.
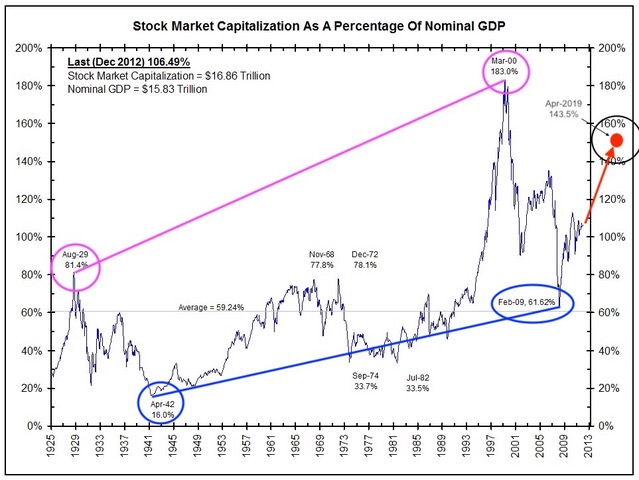
Part of what made the stock market crash of 1929 so destructive was that the capitalization of the stock market had become quite high relative to the overall economy, likely peaking at around 81% of nominal GDP (PDF) in August 1929. In 1987 however, market cap was closer to the long term average of just 62% of GDP, limiting the impact of the crash.
It’s hard to find one consistent measure of market-cap that spans from 1929 to today, but a best attempt at using the same methodology put us at 143% in mid 2019, a level only exceeded by the peak of the Dot-Com Bubble. This selloff is extremely dangerous.

Hopefully, the terrifying market crash over the last two weeks has revealed to policy makers the folly of spending years intentionally creating systemic risk by boosting financial asset prices beyond that which is justified by their fundamentals in a bid to supercharge an already expanding economy.
Of course, we all know that policy makers will not learn that lesson and will instead double down on even more wildly imprudent ideas in order to save us from the massive risks that they have embedded into the economy. No matter what happens, nothing good will come from the last decade of imprudent policy decisions.
Would you like to be notified when we publish a new article on The Sounding Line? Click here to subscribe for free.
Would you like to be notified when we publish a new article on The Sounding Line? Click here to subscribe for free.

