Submitted by Taps Coogan on the 7th of January 2020 to The Sounding Line.
Enjoy The Sounding Line? Click here to subscribe for free.
Enjoy The Sounding Line? Click here to subscribe.
This article is the fifth part in a series exploring oil and gas production in the seven major US shale basins. To read about the Anadarko, Appalachia, Bakken, and Eagle Ford basins, click here, here, here, and here.
Today, we will discuss a collection of charts that detail oil and gas production, the number of drilling rigs and wells completed, and a few measures of productivity in the Haynesville Basin. Haynesville is the smallest US shale basin in terms of oil production, but it is the third largest for natural gas production. All of the charts are based on the most recent data from the US Energy Information Agency.
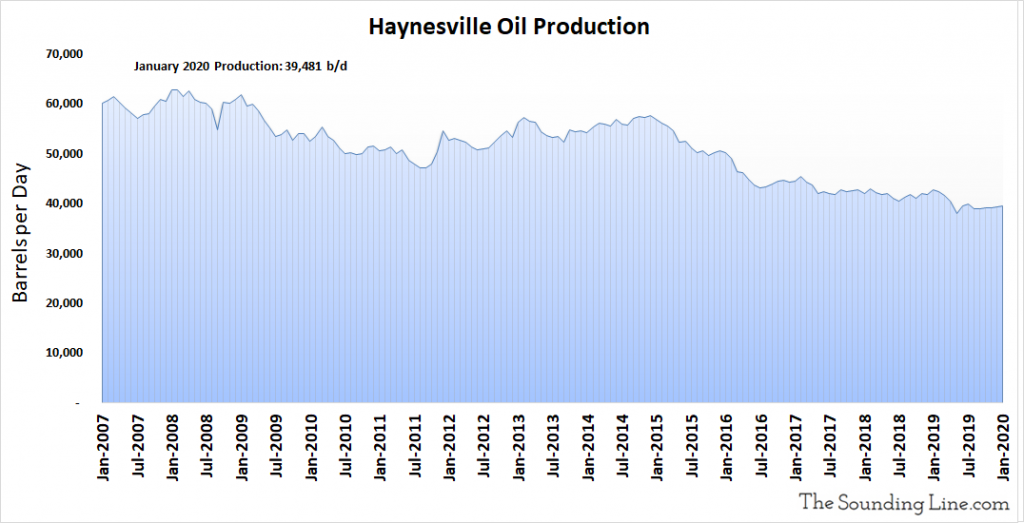
Haynesville Oil Production
Oil production in the Haynesville basin was 39,481 barrels per day (b/d) in January 2020. Low to begin with, Haynesville oil production has declined by roughly a third since 2007.
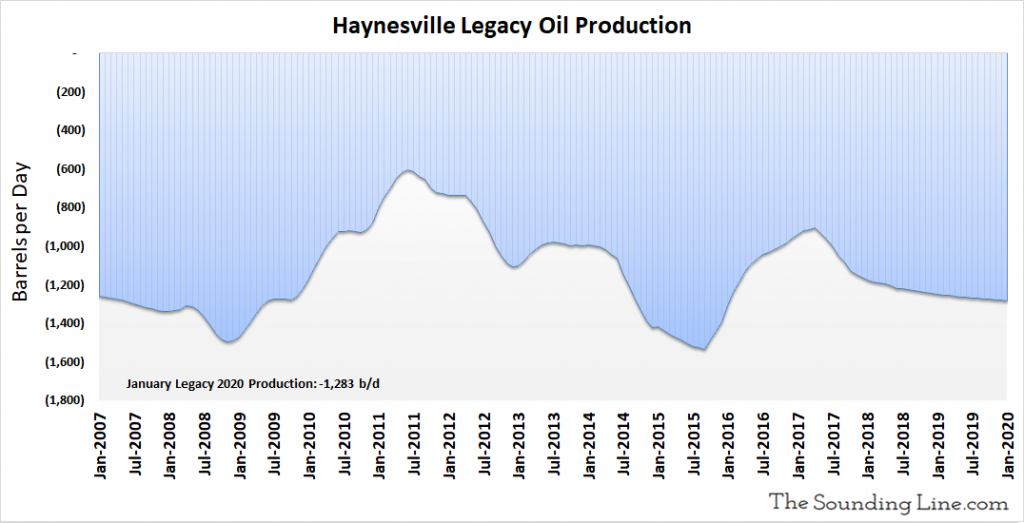
Legacy Oil Production
The following chart shows shows the production decline rate of wells older than a month. That decline rate was -1,283 b/d and has not shown a clear trend since 2007.
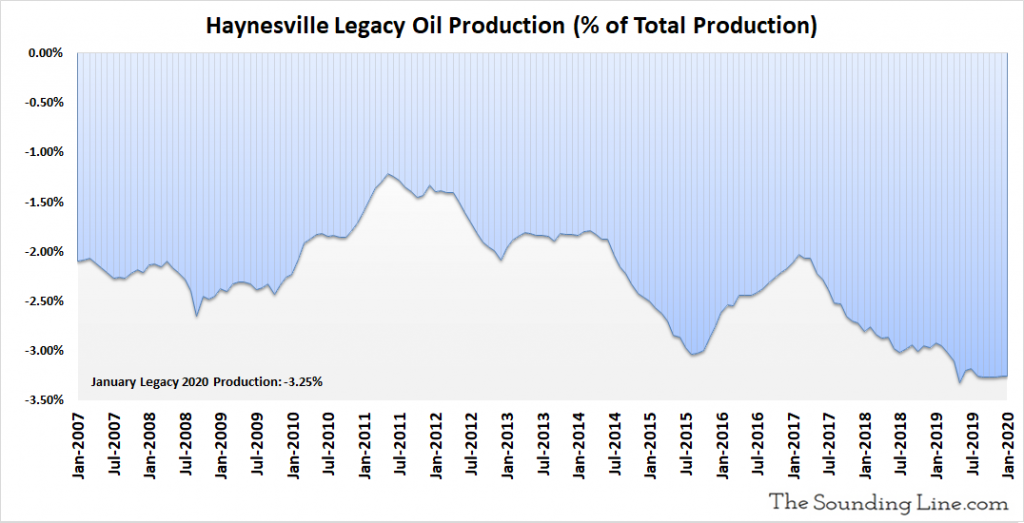
As a percent of total production, legacy oil production declines were 3.25% of total production, nearly the highest level on record. There has been a slight trend of rising legacy production declines as a percent of total production since 2007.
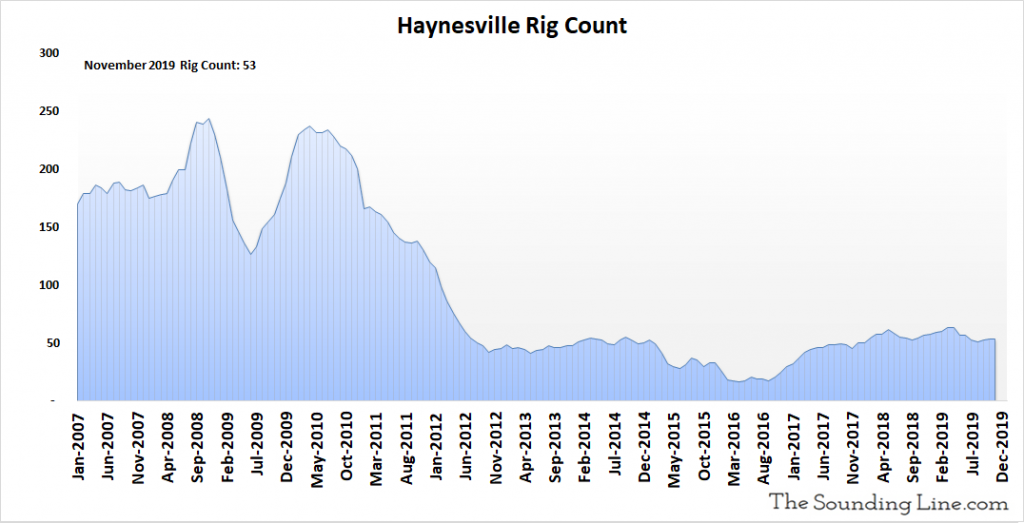
Rig Count
In November 2019, the most recent date for which data is available, there was estimated to be 53 rigs drilling new wells in the Haynesville basin. The rig count has actually risen by two since August and remains slightly above the average since 2012, though far below levels seen prior to that.
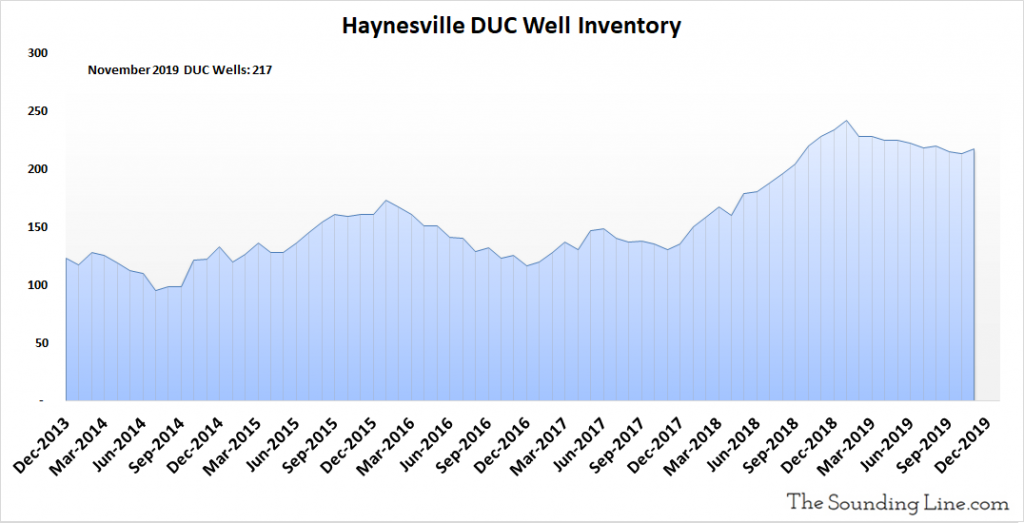
DUC Well Count
The DUC well count is the number of drilled but uncompleted wells in the Eagle Ford basin. These represent an inventory of wells that have already been drilled by rigs but are not yet producing oil and gas. This inventory rose slightly to 217 wells in November 2019. DUC Wells have been trending lower since early 2019 but remain at high levels.
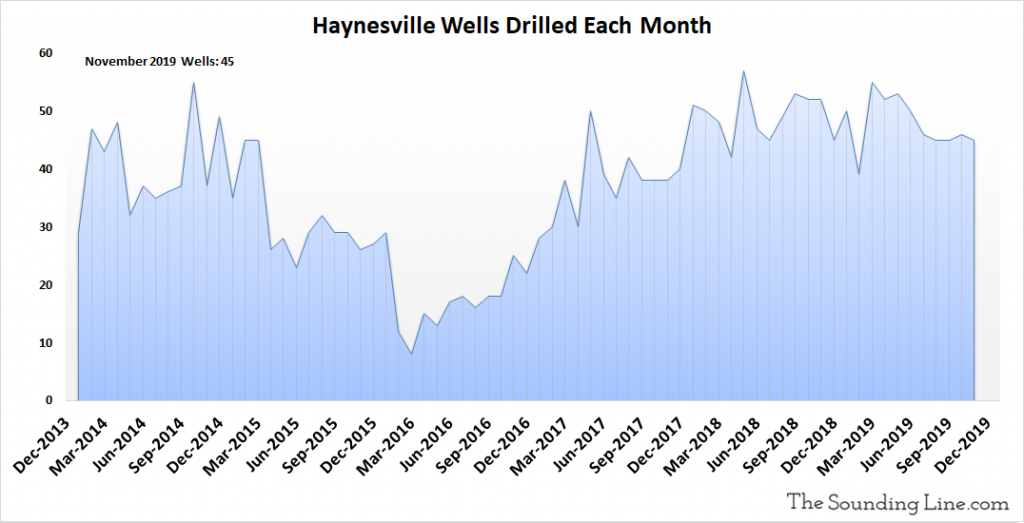
Wells Drilled per Month
The following chart shows the number of new oil and gas wells drilled every month. 45 wells were drilled in November 2019. This number has been declining since early 2019, though remains relatively high compared to the average since 2013.
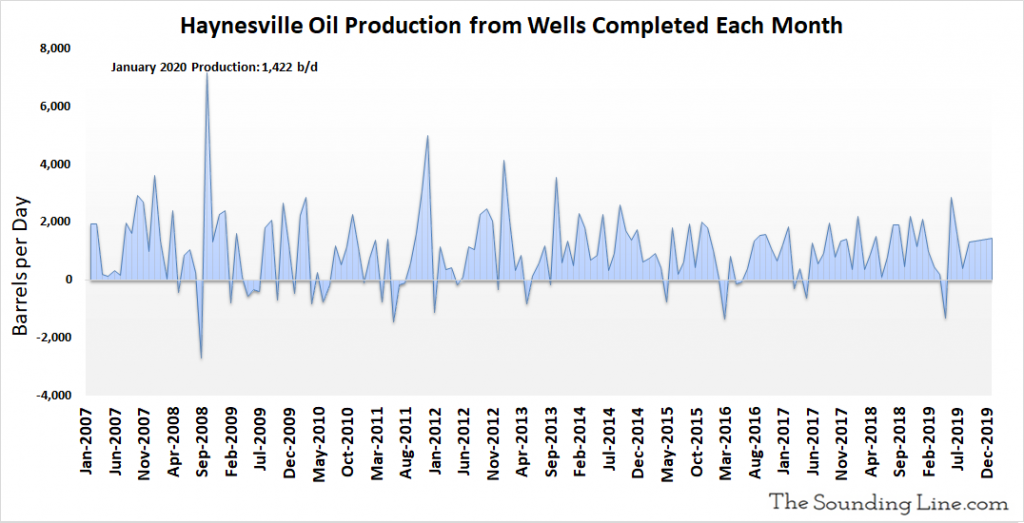
Oil Production from Wells Completed Each Month
The following chart shows the oil production from just those wells that were completed in any given month. That may include wells that were previously DUC wells, but that were completed that month. Production from newly completely wells was 1,422 b/d as of January 2020, roughly the average since 2007.
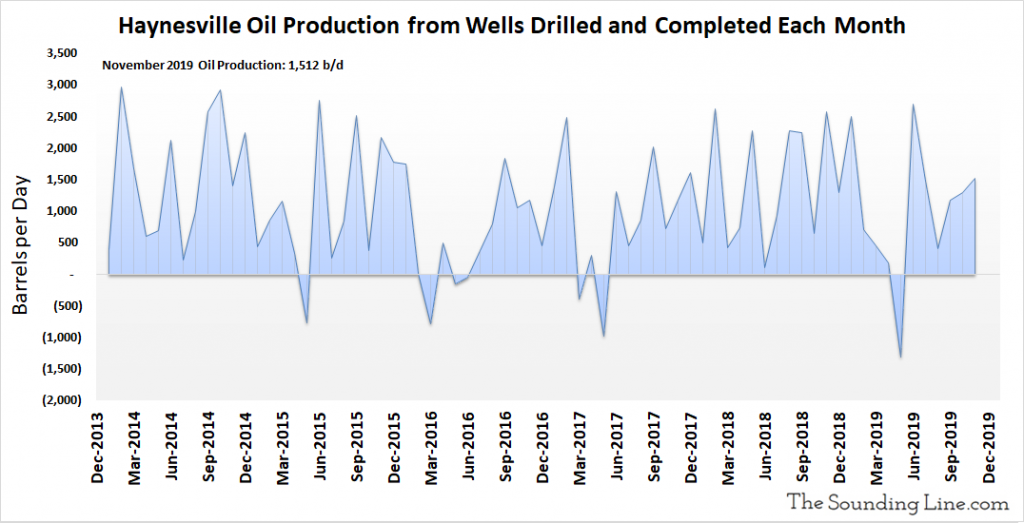
Oil Production from Wells Drilled and Completed Each Month, Excluding DUC Wells
The following chart excludes production from DUC wells that were completed in a given month and shows the production just from wells drilled and completed each month. It is an inferred number based on changes in production, legacy production, drilled wells, and completed wells. For months where the number of DUC wells increased, the implied production potential of those wells is included in the production figure even though that oil was not yet produced. Production from newly drilled and completed wells was 1,512 b/d as of November 2019. There is no clear trend of increasing production from wells drilled and completed each month since 2013.
Oil Production per Well Completed Each Month
The following chart shows the oil production just from newly completed wells, per well, per month, including DUC wells that were completed. Production per completed well was 34 b/d as of November 2019. There has been no clear trend of increasing production per new well since at least 2013.

Natural Gas Production
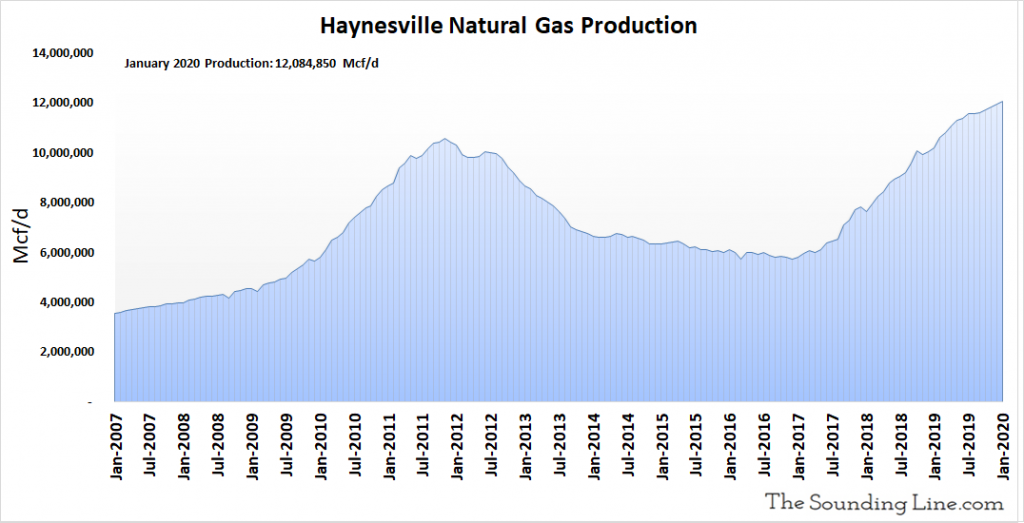
Natural gas production in January 2020 hit an all-time record high slightly above 12 million Mcf/d.
Legacy Natural Gas Production
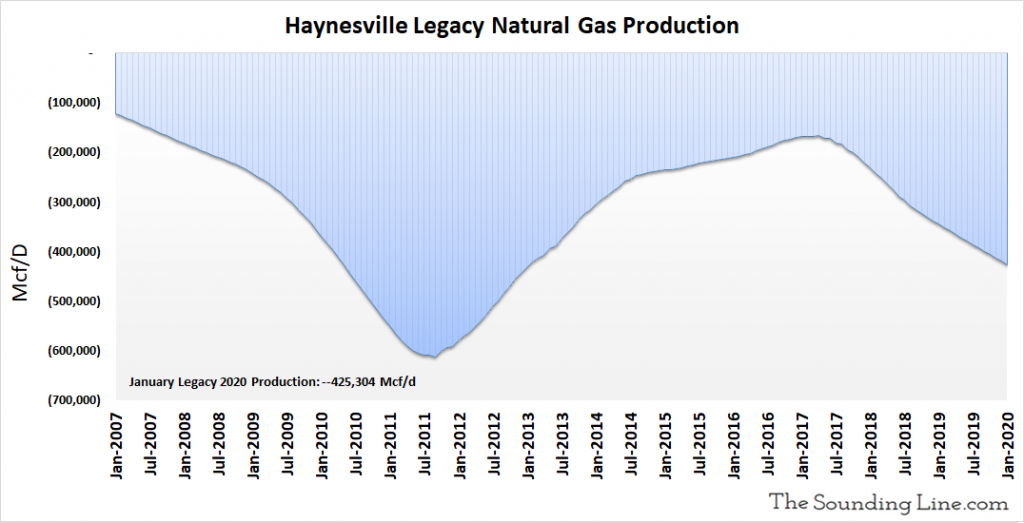
As with legacy oil production, the following chart shows the production decline rate of wells older than a month. That decline rate reached -425,304 Mcf/d in January 2020. While rising, it remains well below the peak from mid 2011.
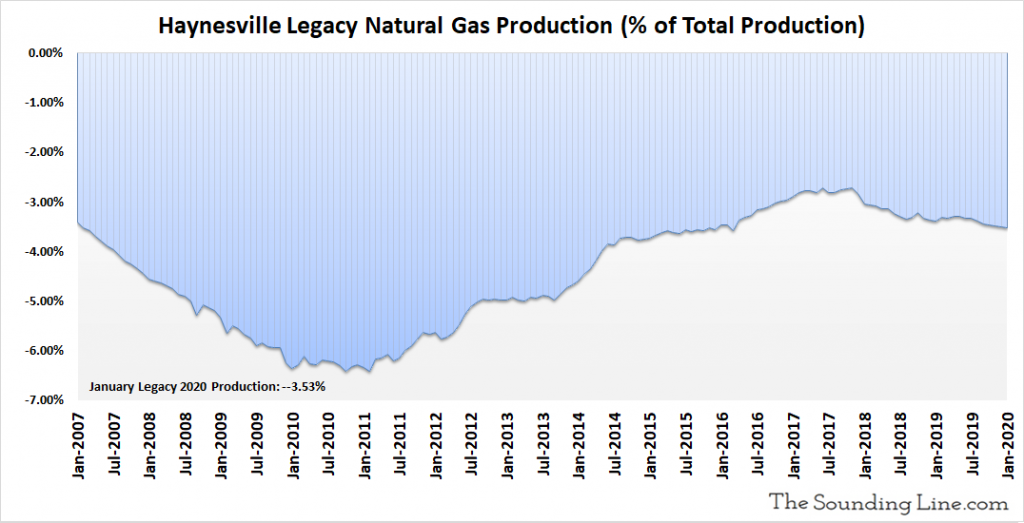
As a percent of total production, legacy declines inched up to 3.53% of production in January 2020, but remain well below the 2010-2011 peak.
Gas Production from Wells Completed Each Month
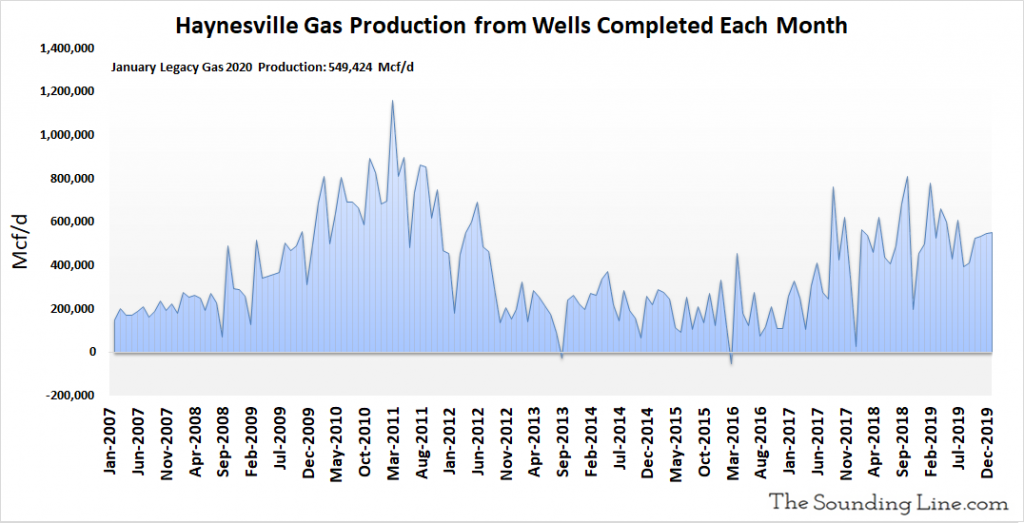
The following chart shows the natural gas production from just those wells that were completed in any given month. That may include wells that were previously DUC wells. Production from newly completely wells was 549,424 Mcf/d as of January 2020. After peaking in 2011, this metric began increasing again in 2017.
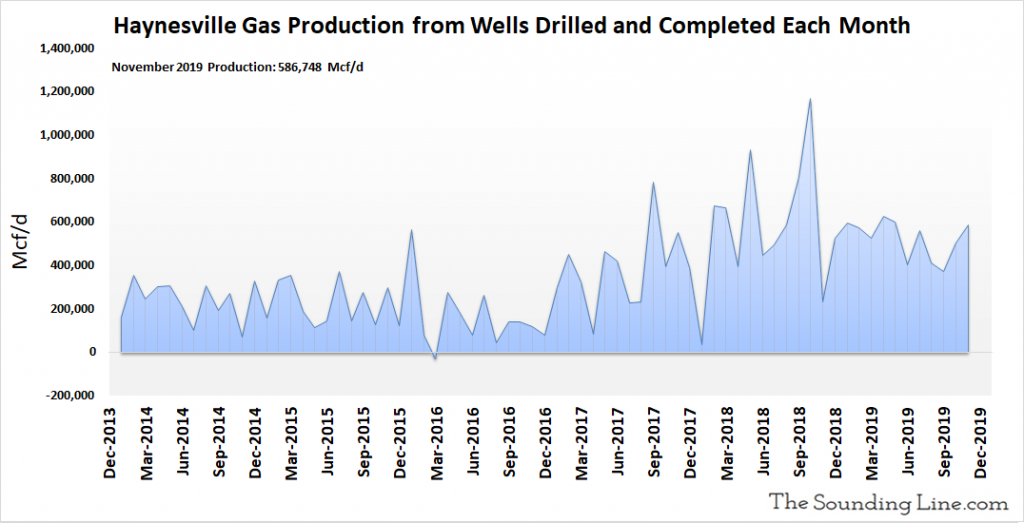
Gas Production from Wells Drilled and Completed Each Month, Excluding DUC Wells
The following chart excludes production from DUC wells completed in a given month and shows the production just from wells drilled and completed each month. It is an inferred number based on changes in production, legacy production, drilled wells, and completed wells. For months where the number of DUC wells increased, the implied production potential of those wells is included in the production figure, even though that gas was not yet produced. Production from newly drilled and completed wells was 586,748 Mcf/d as of November 2019. This metric began increasing substantially around early 2017 and represents one of the only examples from the various shale basins where rising production is clearly attributable to newly drilled wells actually producing more oil or gas.
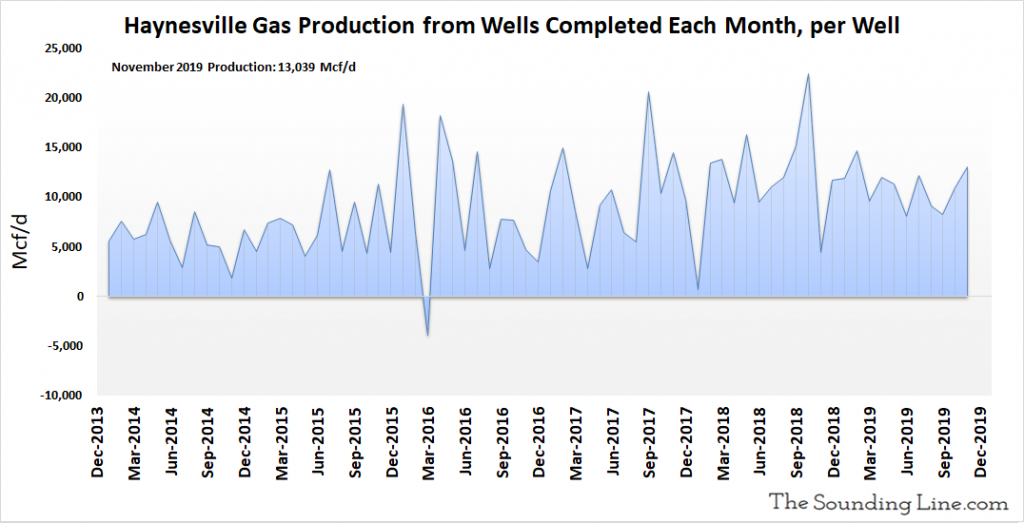
Gas Production from Wells Completed Each Month, per Well
Natural gas production each month from newly completed wells, per well, was 13,012 Mcf/d as of November 2019. There has been a modest strengthening of this metric since 2013, though the trend has been less clear since 2018. By comparing the chart above to this chart, one can see that while some of the rise in the production from newly drilled and completed wells since 2017 is from gains per well, most is attributable to the recovery in drilling activity that started in 2016.
Some Thoughts
Haynesville is not a major oil producing region. Nonetheless, production has been declining since 2007. Legacy declines have risen modestly as a percent of oil production, while production from newly drilled and completed wells has shown no evidence of increasing productivity per newly drilled well. The rig count fell dramatically after 2011 and has stabilized at a lower level since then.
Haynesville natural gas production is a different story. Overall gas production is much more significant (it is the third highest producing basin) and has risen to a record level as of January 2020. Legacy declines have moderated relative to production since 2011 and, uniquely among the basins we have examined so far, there is more obvious evidence of modestly increasing productivity per newly completed well. Even when excluding DUC wells there is an observable trend of increasing productivity from newly drilled wells. Nonetheless, most of the production gains since 2017 are due to a rising number of wells drilled and utilization of DUC wells.
As long as modest gains in production and drilling activity can be maintained, it is reasonable to expect gas production in the Haynesville basin to remain robust.
Would you like to be notified when we publish a new article on The Sounding Line? Click here to subscribe for free.
Would you like to be notified when we publish a new article on The Sounding Line? Click here to subscribe for free.

