Taps Coogan – September 10th, 2020
Enjoy The Sounding Line? Click here to subscribe for free.
Enjoy The Sounding Line? Click here to subscribe.
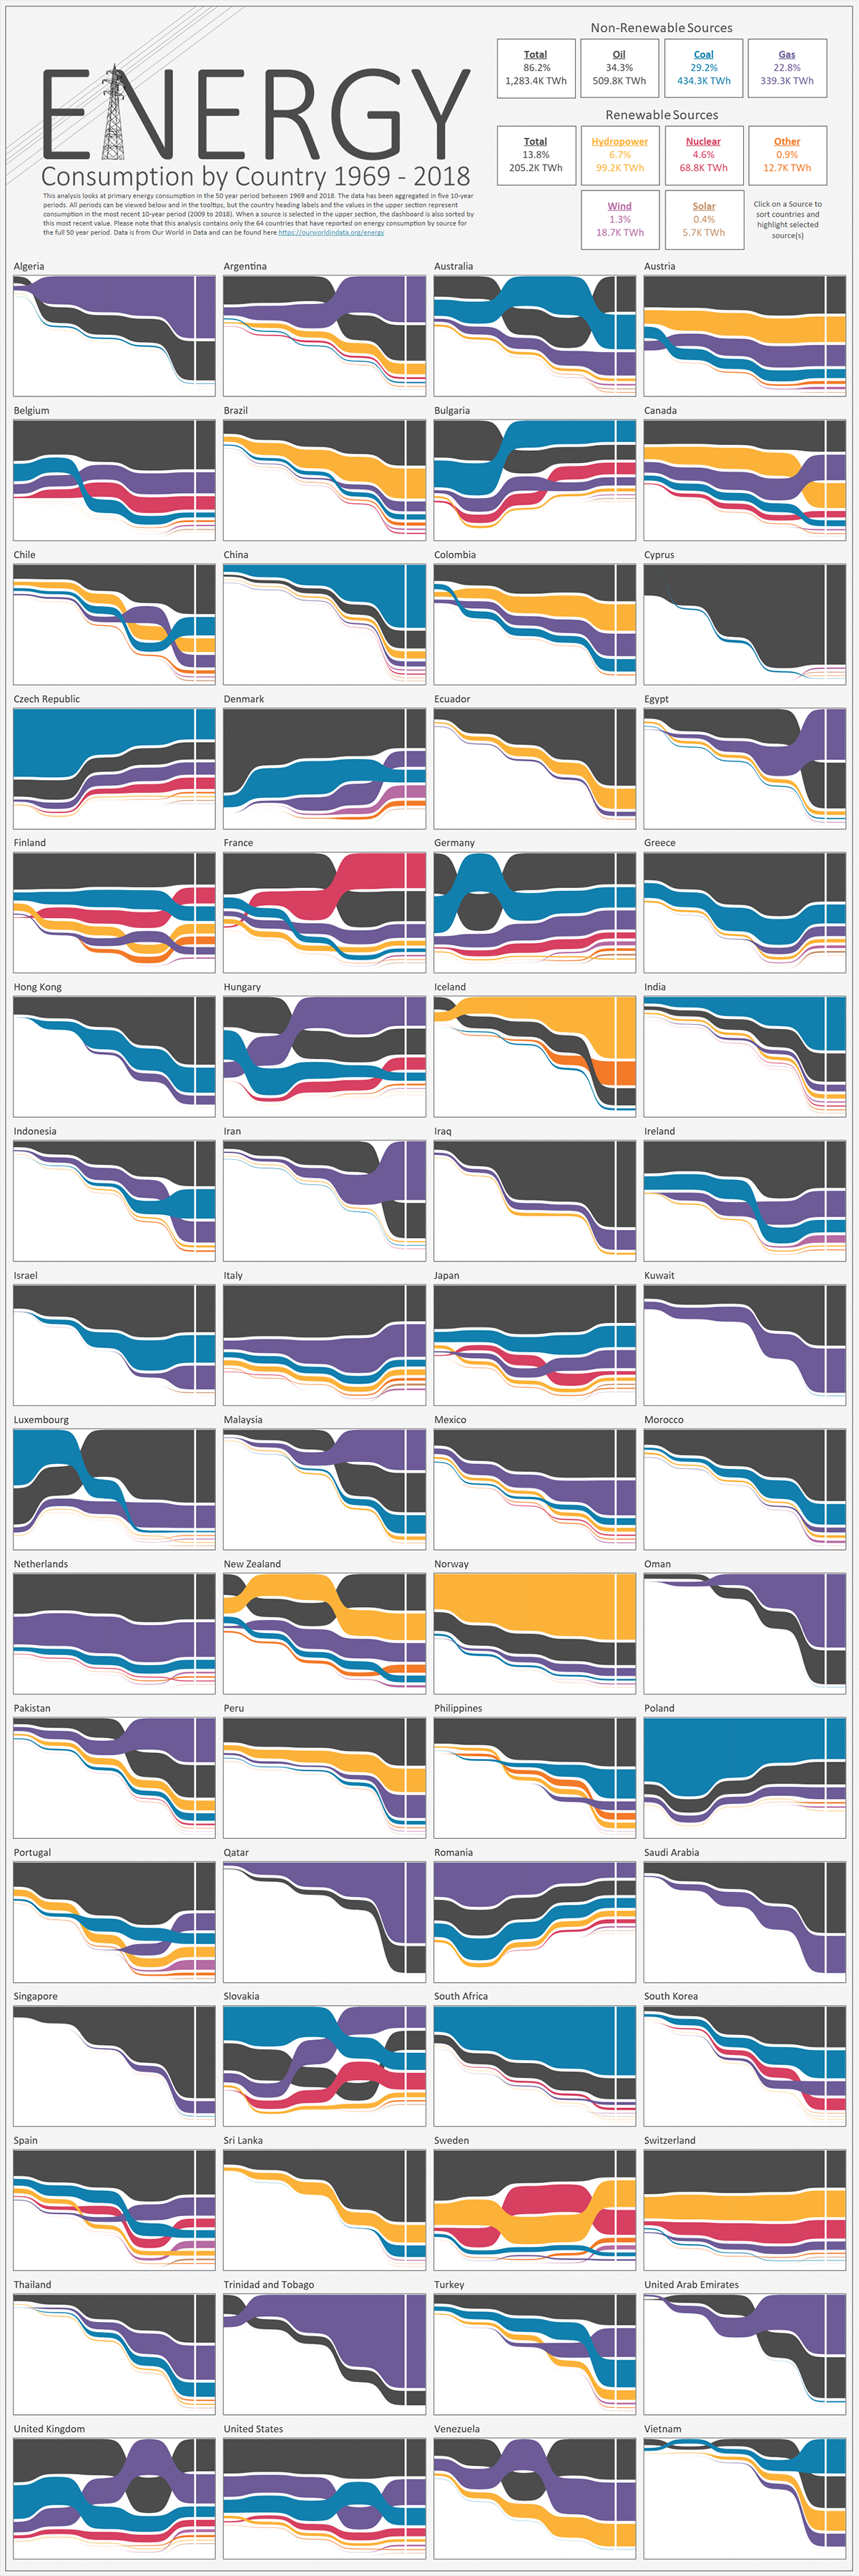
The following chart, from Visual Capitalist, shows the composition of energy consumption for countries around the world since 1969 through 2018. It includes not just the sources of energy production used for electricity generation but for transportation as well.

As Visual Capitalist notes: “fossil fuels collectively accounted for a massive 86.2% of total energy consumption over 2009-2018… Among fossil fuel sources, oil emerges as the clear leader, responsible for 34.3%… Closely following oil is coal, which countries rely on for its abundance, low costs, and low infrastructure requirements. Over the last decade of data, 29.2% of total energy came from coal… (Natural) Gas accounted for 22.8%… Only 13.8% of energy consumption over 2009-2018 came from renewable or alternative sources of energy, and hydropower accounts for nearly half of it… Wind and solar energy were responsible for a mere 1.7% of energy consumption“
| Energy Source | % of Total Energy Consumption (2009-2018) | Sum of Total Energy (2009-2018) (TWh) |
|---|---|---|
| Oil | 34.3% | 509,800 |
| Coal | 29.2% | 434,300 |
| Gas | 22.8% | 339,300 |
| Hydropower | 6.7% | 99,200 |
| Nuclear | 4.6% | 68,800 |
| Wind | 1.3% | 18,700 |
| Geothermal/Biomass/Other | 0.9% | 12,700 |
| Solar | 0.4% | 5,700 |
| Total | 100.0% | 1,389,300 TWh |
Of course, wind and solar power capacity was negligible for most of the period between 1969 through 2018. It is going to represent a significantly greater percentage of energy consumption over the next 50 years.
Would you like to be notified when we publish a new article on The Sounding Line? Click here to subscribe for free.
Would you like to be notified when we publish a new article on The Sounding Line? Click here to subscribe for free.

