Taps Coogan – July 9th, 2022
Enjoy The Sounding Line? Click here to subscribe for free.
Enjoy The Sounding Line? Click here to subscribe for free.
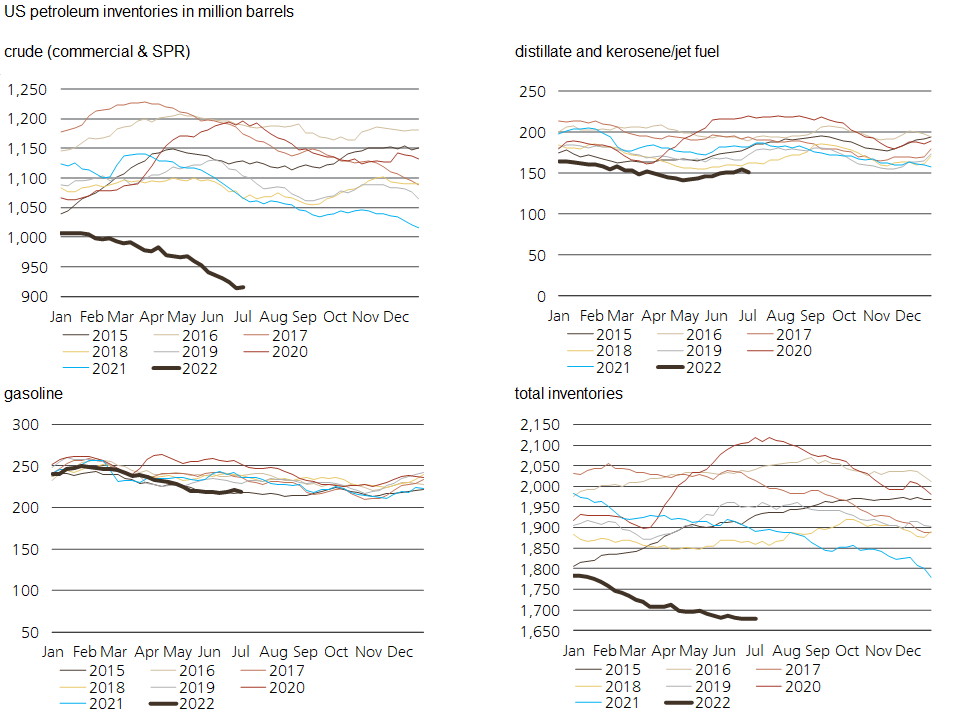
The following chart, via Giovanni Staunovo, shows US crude and refined product inventories. We shared an earlier version of this chart below back in May and, in the subsequent couple months, the shortage of crude has become substantially more acute.

Since May, crude inventories have fallen by another roughly 5% to their lowest levels in years. Inventories of refined products, while at the very low end of the range for the past 7 years, are not nearly as low.
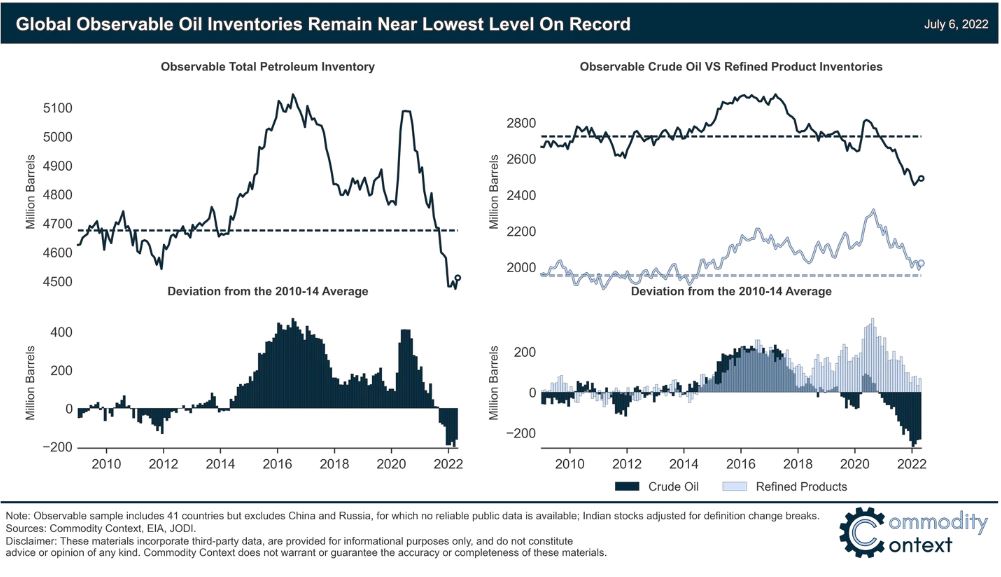
The global picture has not improved much either. The following chart from Commodity Context shows only the slightest increase in global observable crude inventories which remain near multi-decade lows.
Here is how Rory Johnson of Commodity Context describes “observable oil inventories:
“Commercial and government-held stocks in 41 inventory-holding countries but does not include China or Russia—both material holders of crude and product inventory—due to a lack of publicly available information. I have also adjusted Indian refined product data to account for data breaks related to definitional changes”

The dramatic drop in oil related equities over the past few weeks (and the more modest drop in oil prices), doesn’t seem to have much of a basis in the supply side of oil markets.
We remain in a resource constrained environment. That means that lower prices and/or lower equity valuations resulting from demand destruction fears will just delay the capital investments needed to increase production enough to exit that demand-constrained environment. Until or unless something more profoundly breaks in the economy, excessive production resulting from to much capital investment in new wells and mines is the only way out for the global economy.
How close are we to that? When oil was flirting around $100 in 2014, Chevron’s capital expenditure budget was over four times as large as it is today. Exxon’s was over twice as large, as was BP’s. Freeport McMoRan’s capital expenditure budget for copper was about 3.5 times as big in 2014. Rio Tinto’s capital expenditure budget was twice as large in 2013 and BHP’s was about three times larger. We are nowhere near the levels of capital expenditures that torpedoed the last commodity bull market.
Would you like to be notified when we publish a new article on The Sounding Line? Click here to subscribe for free.
Would you like to be notified when we publish a new article on The Sounding Line? Click here to subscribe for free.

