Submitted by Taps Coogan on the 30th of January 2020 to The Sounding Line.
Enjoy The Sounding Line? Click here to subscribe for free.
Enjoy The Sounding Line? Click here to subscribe.
This article is the second part in a series exploring oil and gas production in the seven major US shale basins. To read the first part of the series, which discussed the Anadarko Basin, read here.
Today, we will discuss a collection of charts which detail oil and gas production, the number of drilling rigs and wells completed, and a few measures of productivity in the Appalachia Basin. All the charts are based on the most recent data from the US Energy Information Agency.
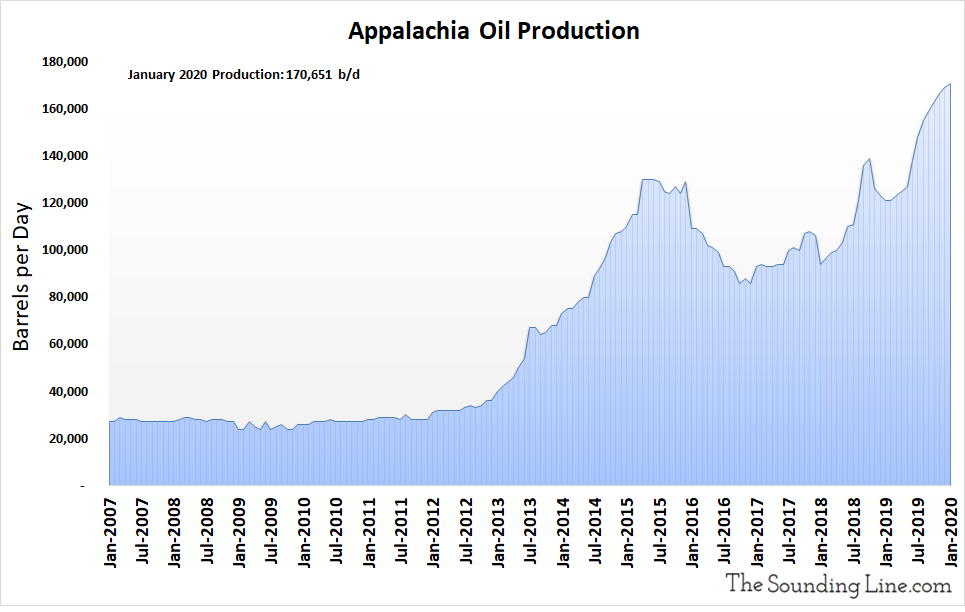
Appalachia Oil Production
Oil production in the Appalachia basin is significantly lower than in Anadarko, hitting an all-time high of 170,651 barrels per day (b/d) in January 2020 (compared to 553,083 b/d in Anadarko). Oil production has increased rapidly since the Spring of 2019, though growth is starting to slow modestly.
Legacy Oil Production
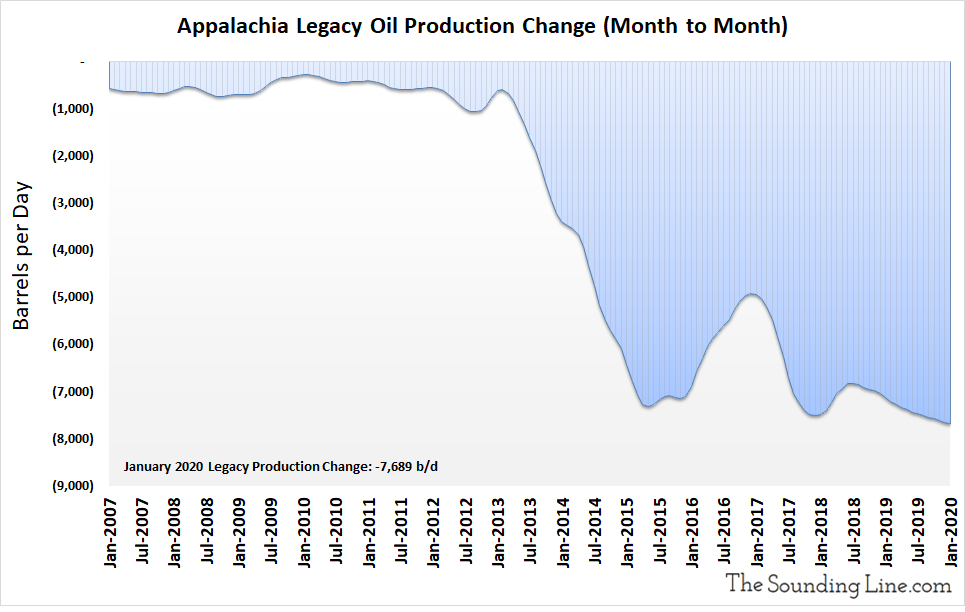
The following chart shows the monthly change in oil production from wells drilled in prior months. In other words, it shows the production decline rate of wells older than a month. That decline rate reached a record 7,689 b/d in January 2020. Although the decline rate is currently at a record, overall decline rates have only increased modestly since 2015 and have improved at times.
Rig Count
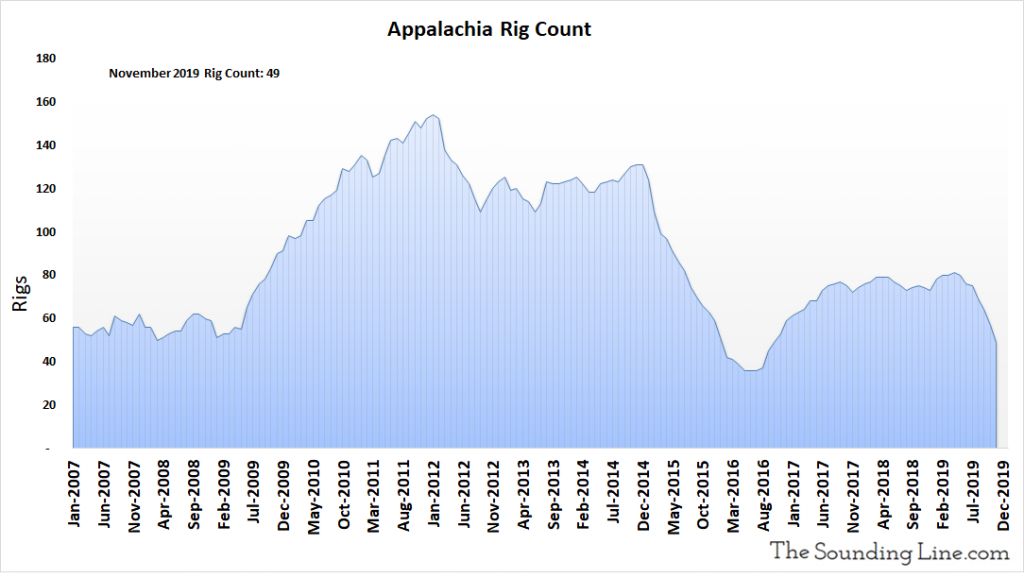
The following chart shows the number of active oil and gas drilling rigs in any given month. In November 2019, the most recent date for which data is available, the rig count declined to just 49. The rig count has only been lower for eight months during 2016 when oil prices collapsed to as low as $26 a barrel.
DUC Well Count
The DUC well count is the number of drilled but uncompleted wells in the Appalachia basin. These represent an inventory of wells that have already been drilled by rigs but are not yet producing oil or gas. This inventory fell to 472 wells as of November 2019, the lowest level on record. DUC wells have been declining since records started in 2014 and are on pace to completely run out sometime within the next two years.

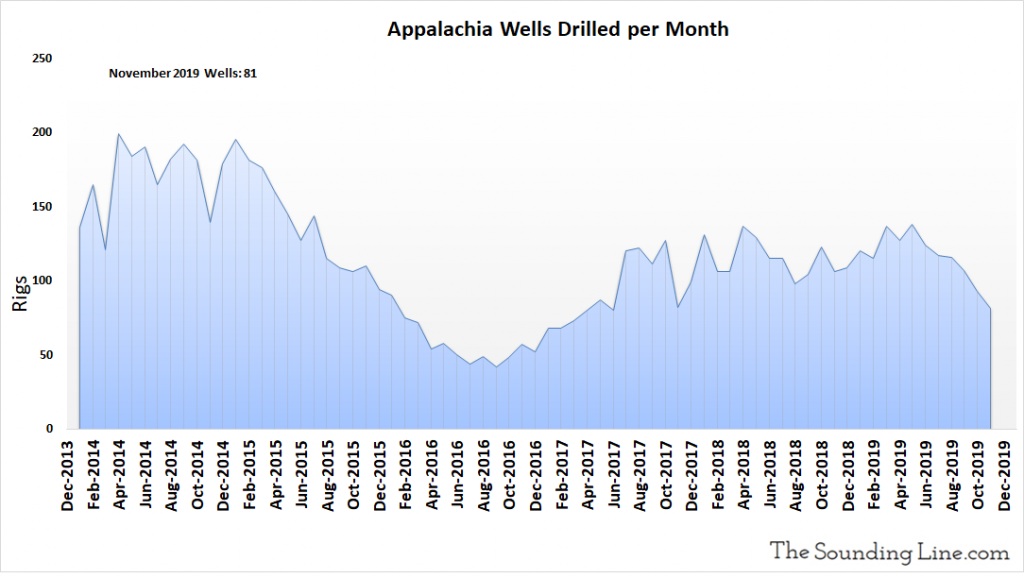
Wells Drilled per Month
The following chart shows the number of new oil and gas wells drilled every month. Just 81 wells were drilled in November 2019, the lowest number since April 2017.
Oil Production from Wells Completed Each Month
The following chart shows the oil production from just those wells that were completed in any given month. That may include wells that were previously DUC wells, but which were completed that month. Production from newly completely wells was 9,353 b/d as of January 2020, modestly above the average since 2014, albeit a decline compared to recent months. Production from newly completed wells has been fairly robust since the start of 2019.

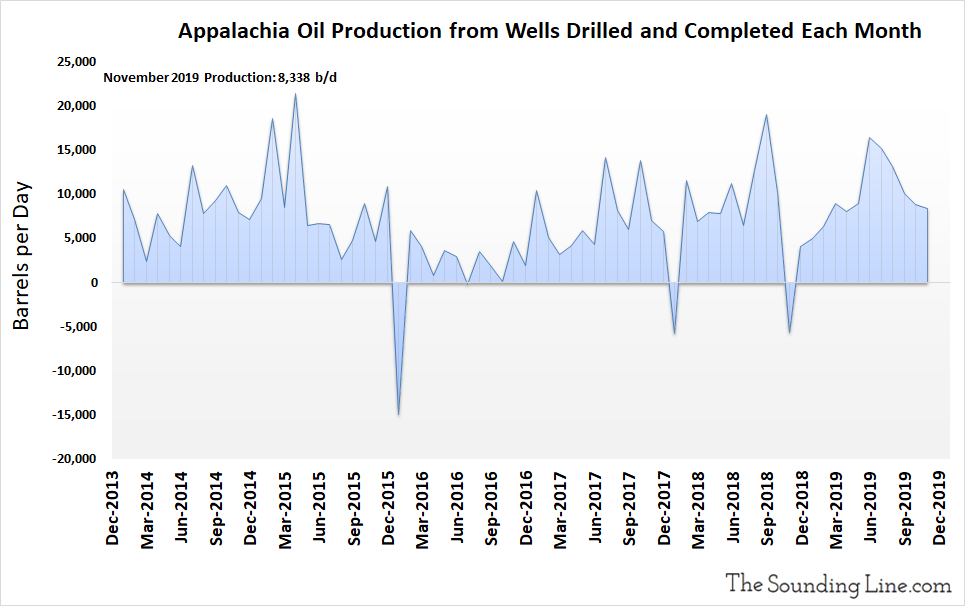
Oil Production from Wells Drilled and Completed Each Month, Excluding DUC Wells
The following chart excludes production from DUC wells which were completed in a given month, and shows the production just from wells drilled and completed each month. It is an inferred number based on changes in production, legacy production, drilled wells, and completed wells. For months where the number of DUC wells increased, the implied production potential of those wells is included in the production figure, even though that oil was not yet produced. Production from newly drilled and completed wells was 8,338 b/d as of November 2019, modestly above the average since at least 2014.
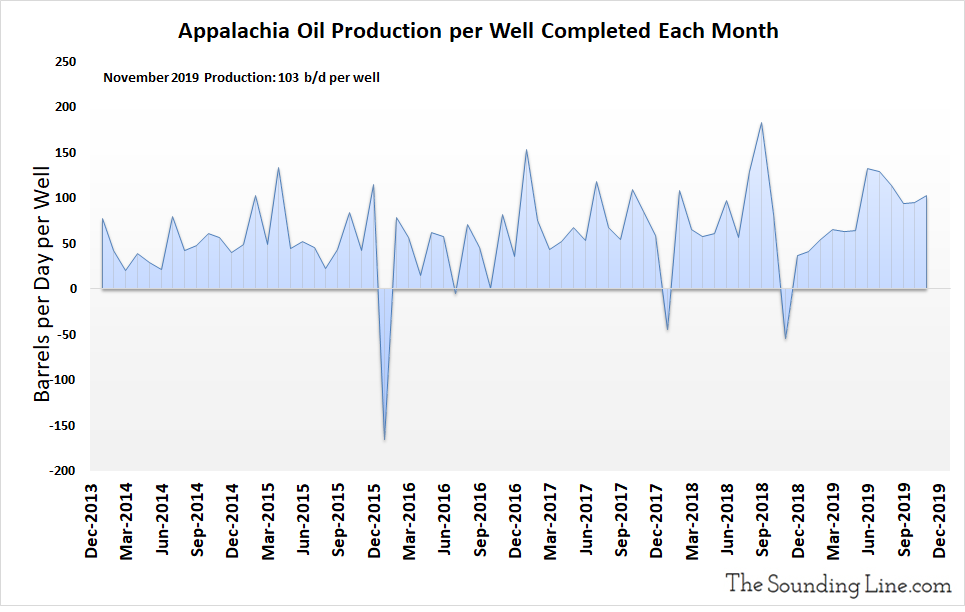
Oil Production per Well Completed Each Month
The following chart shows the oil production just from newly completed wells, per well, per month, including DUC wells which were completed. Production per completed well was 103 b/d as of November 2019, well above the average since 2014. While this figure for the Anadarko basin showed no increasing trend, for the Appalachia basin there does appear to be a modest improvement in production per new well over time.
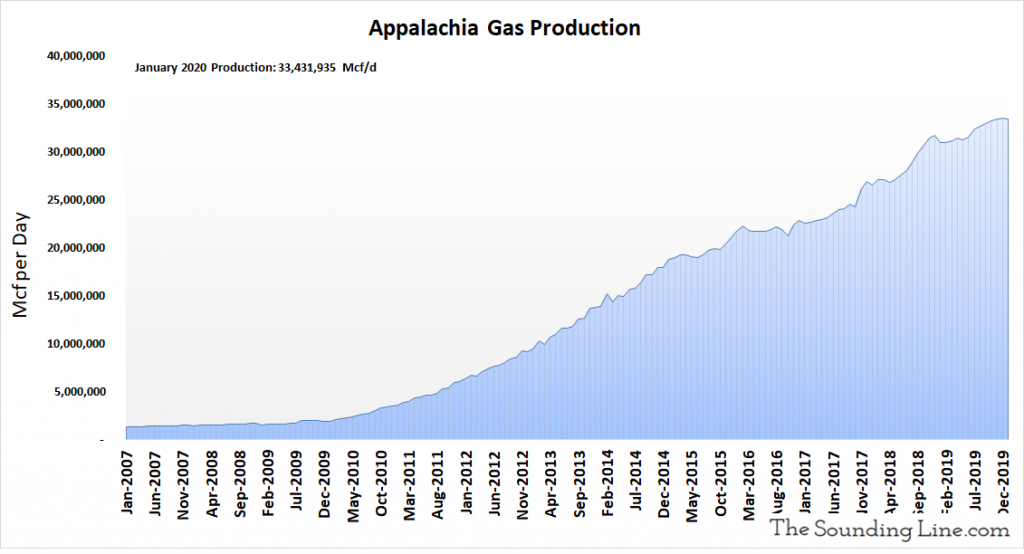
Natural Gas Production
While the Appalachia basin lags behind the Anadarko basin in oil production, it produces significantly more natural gas. Natural gas production in January 2020 hit 33.4 million Mcf/d (compared to 7.5 million Mcf/d in Anadarko). January’s natural gas production was slightly below the record 33.5 million Mcf/d set in December 2019.
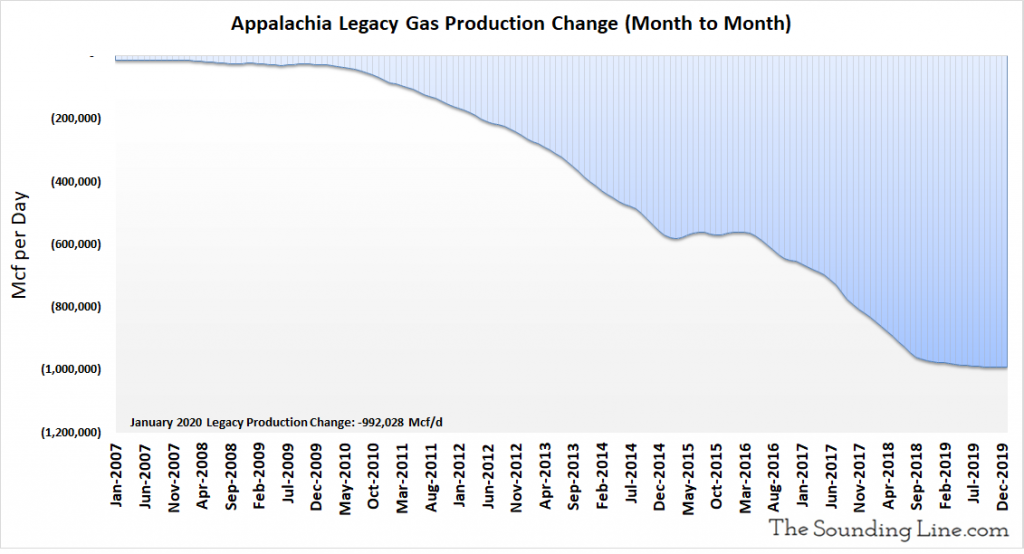
Legacy Natural Gas Production
As with legacy oil production, the following chart shows the monthly change in natural gas production from wells drilled in prior months. In other words, it shows the production decline rate of wells older than a month. That decline rate reached a near record of over 992,000 Mcf/d in January 2020. The rate of decline has been fairly constant since late 2018.
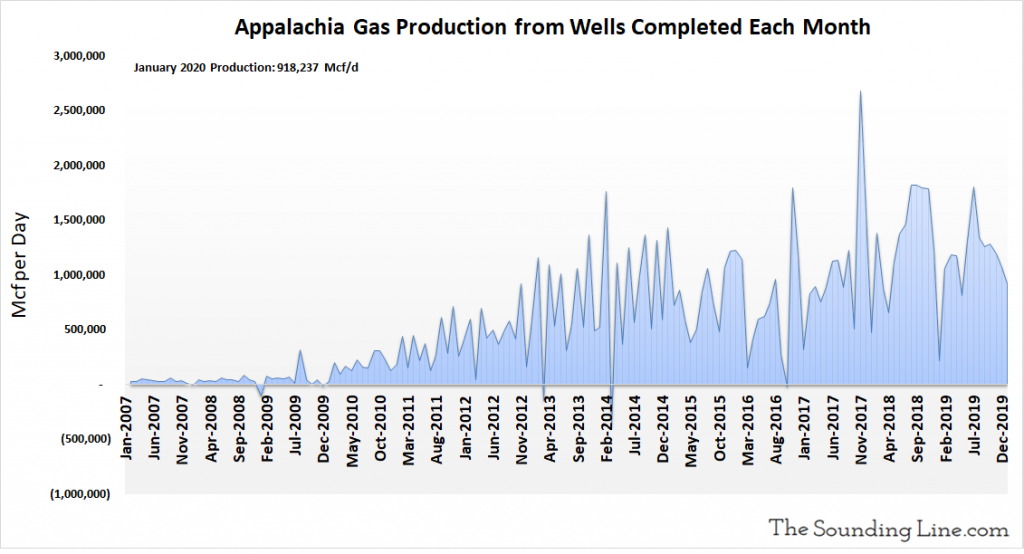
Gas Production from Wells Completed Each Month
The following chart shows the natural gas production from just those wells that were completed in any given month. That may include wells that were previously DUC wells. Production from newly completely wells was slightly over 918,237 Mcf/d, as of November 2019. This metric trended higher until late 2017, and has struggled to move higher since.
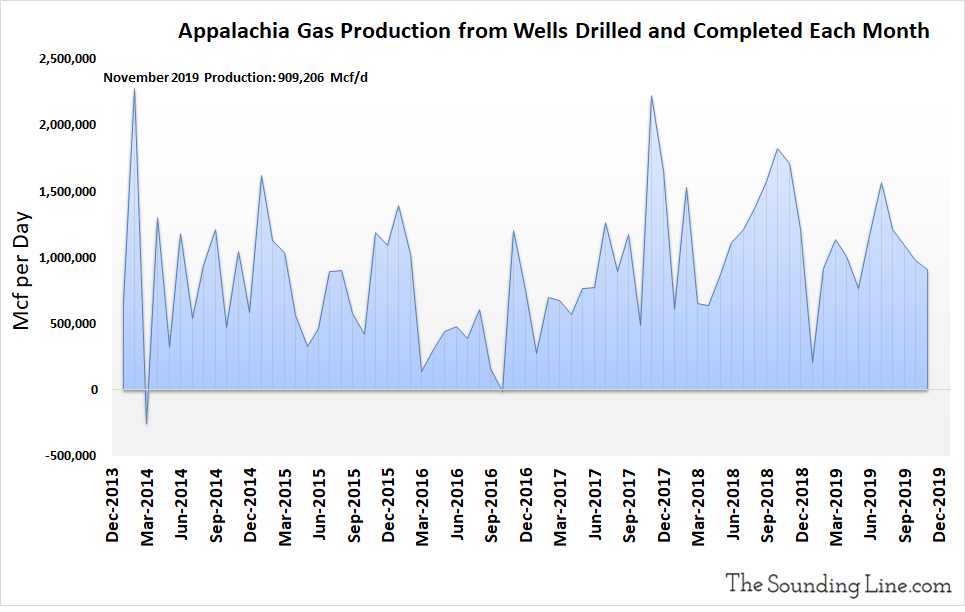
Gas Production from Wells Drilled and Completed Each Month, Excluding DUC Wells
The following chart excludes production from DUC wells completed in a given month and shows the production just from wells drilled and completed each month. It is an inferred number based on changes in production, legacy production, drilled wells, and completed wells. For months where the number of DUC wells increased, the implied production potential of those wells is included in the production figure, even though that gas was not yet produced. Production from newly drilled and completed wells was 909,206 Mcf/d as of November 2019. This metric has shown no clear trend of increasing.
Some Thoughts
On the surface, oil and gas production from the Appalachia basin seems to be growing robustly. However, much like in the Anadarko Basin, rising production of oil and gas seems to be chiefly attributable to ‘burning’ through the inventory of DUC wells that was built when substantially more rigs were in the field drilling wells.
Appalachia appears somewhat more robust than Anadarko in that there has been a modest trend of increasing oil production from newly completed wells. The trend of increasing gas production from newly completed wells disappears when excluding recently completed DUC wells, suggesting that the rise has more to do DUC wells drilled in the past than wells being drilled today.
Because legacy production declines in oil and gas have stabilized over the last year, and because production from new wells has held up, Appalachia has managed to continue to grow oil and gas production robustly. While this may continue for some time, at the current pace of consumption the DUC well inventory will be depleted with the next two years. Some analysts believe that the EIA’s DUC well figures may be heavily inflated, meaning producers may burn through the inventory much sooner.
As we noted for the Anadarko basin, unless rig counts rise significantly, which would presumably require significantly higher prices, Appalachia seems headed for a peak in production within the next year or two.
We will discuss the remaining five US shale basins in the coming days.
Would you like to be notified when we publish a new article on The Sounding Line? Click here to subscribe for free.
Would you like to be notified when we publish a new article on The Sounding Line? Click here to subscribe for free.

