Submitted by Taps Coogan on the 18th of January 2020 to The Sounding Line.
Enjoy The Sounding Line? Click here to subscribe for free.
Enjoy The Sounding Line? Click here to subscribe.
This article is the seventh in a series exploring oil and gas production in the seven major US shale basins. To read about the Anadarko, Appalachia, Bakken, Eagle Ford, Haynesville, and Niobrara basins click here, here, here, here, here, and here.
Today, we will discuss a collection of charts that detail oil and gas production, the number of drilling rigs and wells completed, and a few measures of productivity in the Permian basin. The Permian is the largest US shale basin in terms of both oil and gas production. All of the charts are based on the most recent data from the US Energy Information Agency.
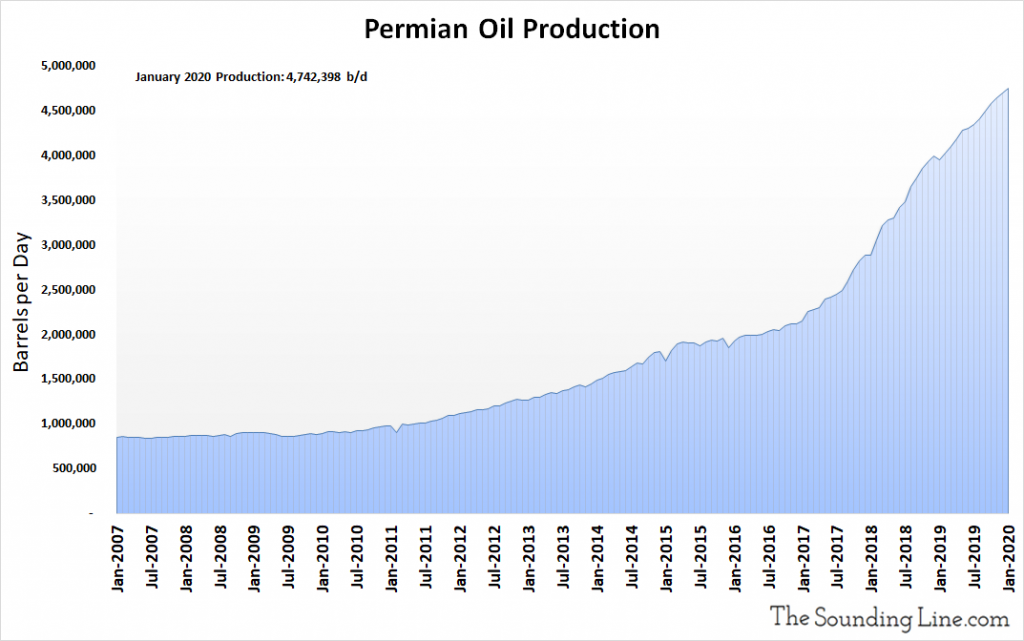
Permian Oil Production
Oil production in the Permian basin hit a record high of over 4.7 million barrels per day (b/d) in January 2020. Permian oil production has accelerated rapidly since early 2017.
Legacy Oil Production
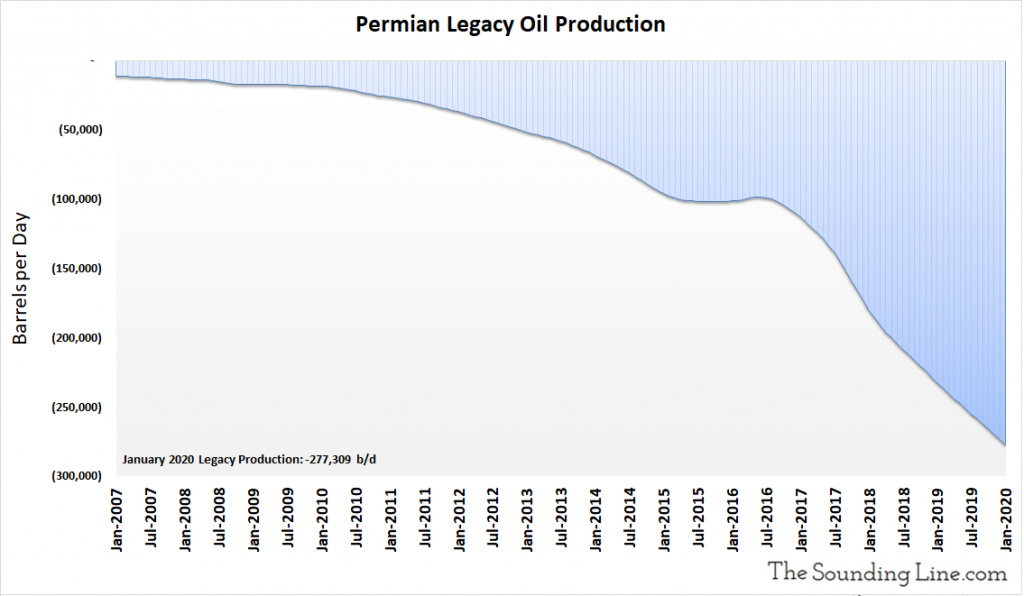
The following chart shows the production decline rate of wells older than a month. That decline rate hit an all-time high of -277,309 b/d in January 2020.
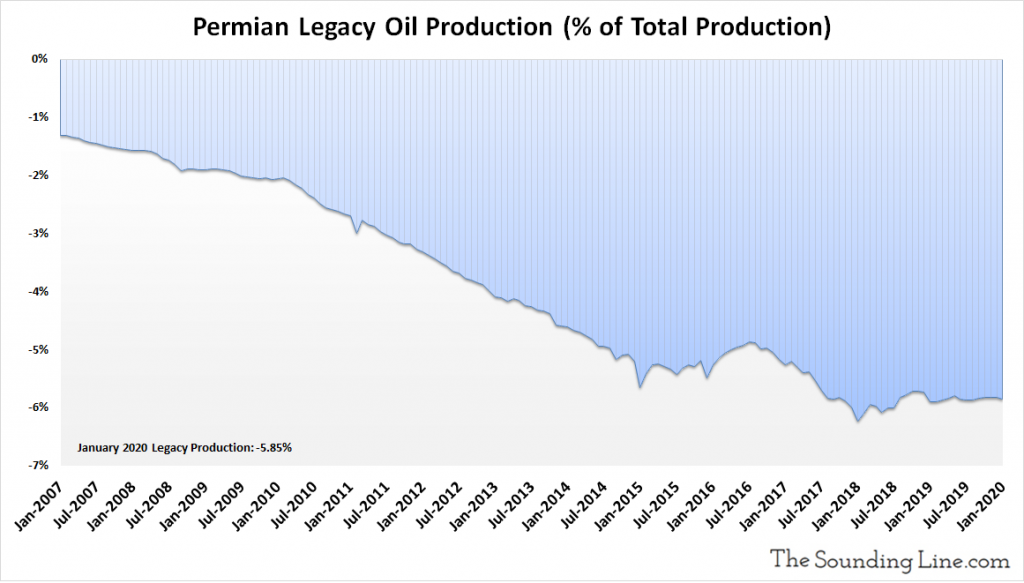
As a percent of total production, legacy oil production declines were 5.85% of total production. Relative to production, legacy declines have been fairly stable since early 2018.
Rig Count
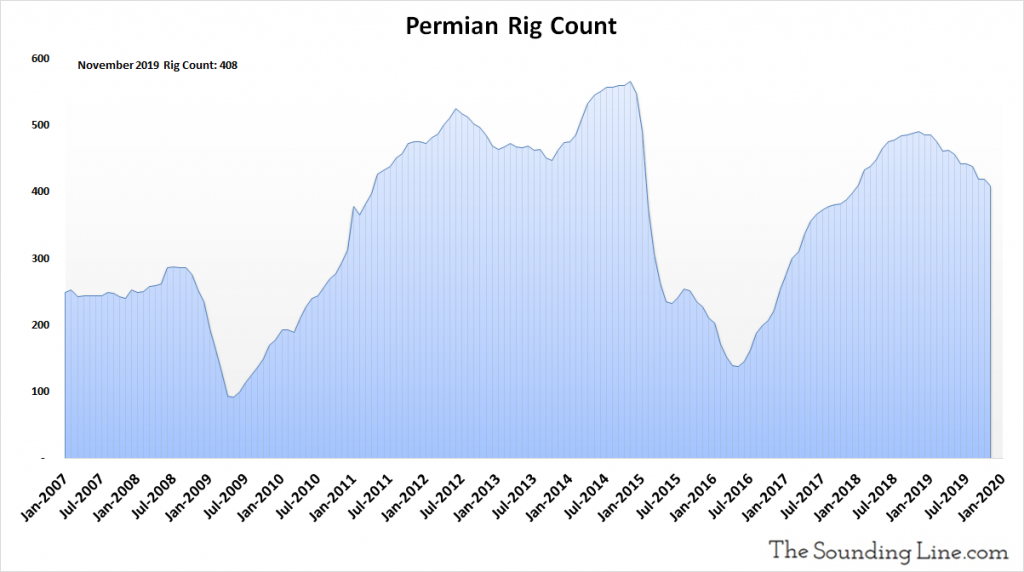
In November 2019, the most recent date for which data is available, there was estimated to be 47 rigs drilling new wells in the Permian basin. The rig count has fallen modestly since early 2019 but still remains well above average levels.
DUC Well Count
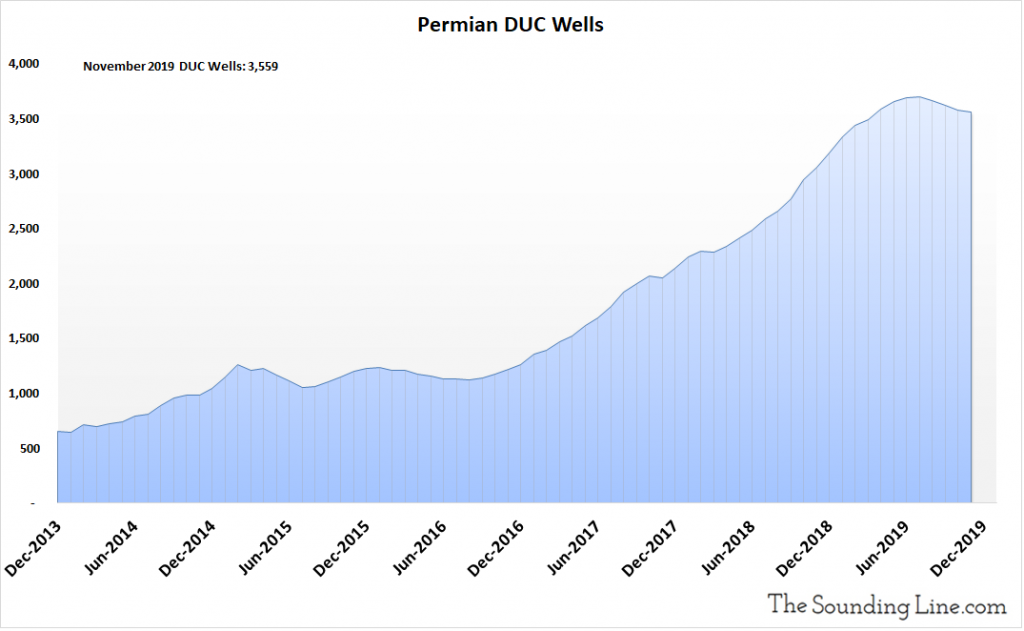
The DUC well count is the number of drilled but uncompleted wells in the Permian basin. These represent an inventory of wells that have already been drilled by rigs but are not yet producing oil and gas. This inventory fell to 3,559 wells in November 2019. DUC well numbers have been trending lower since mid 2018, though remain at very high levels.
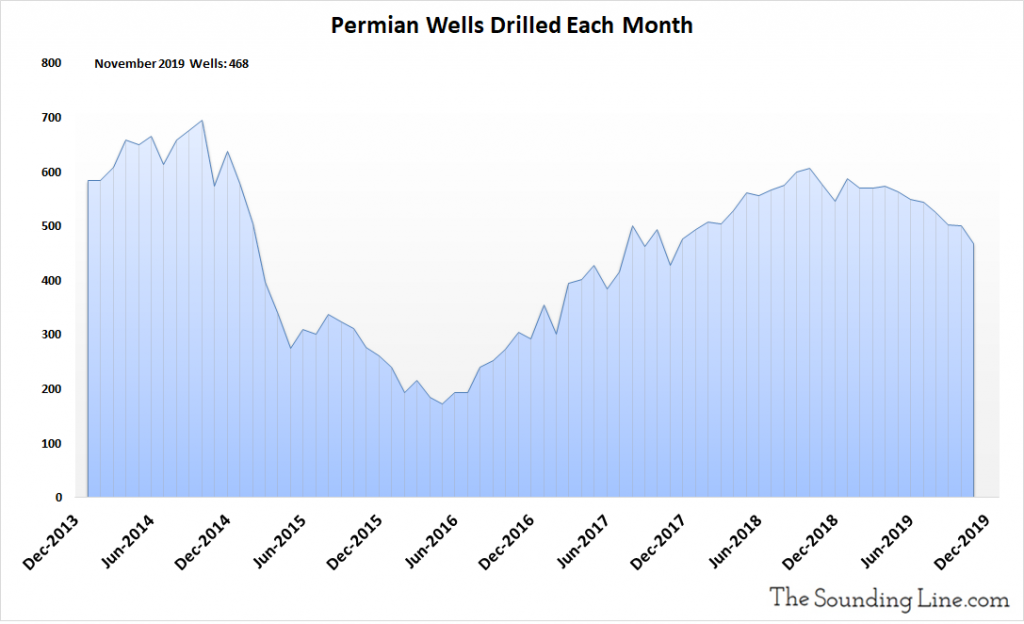
Wells Drilled per Month
The following chart shows the number of new oil and gas wells drilled every month. 468 wells were drilled in November 2019. This number has been declining moderately since early late 2018, as rig count has fallen. It is approaching average levels since 2013.
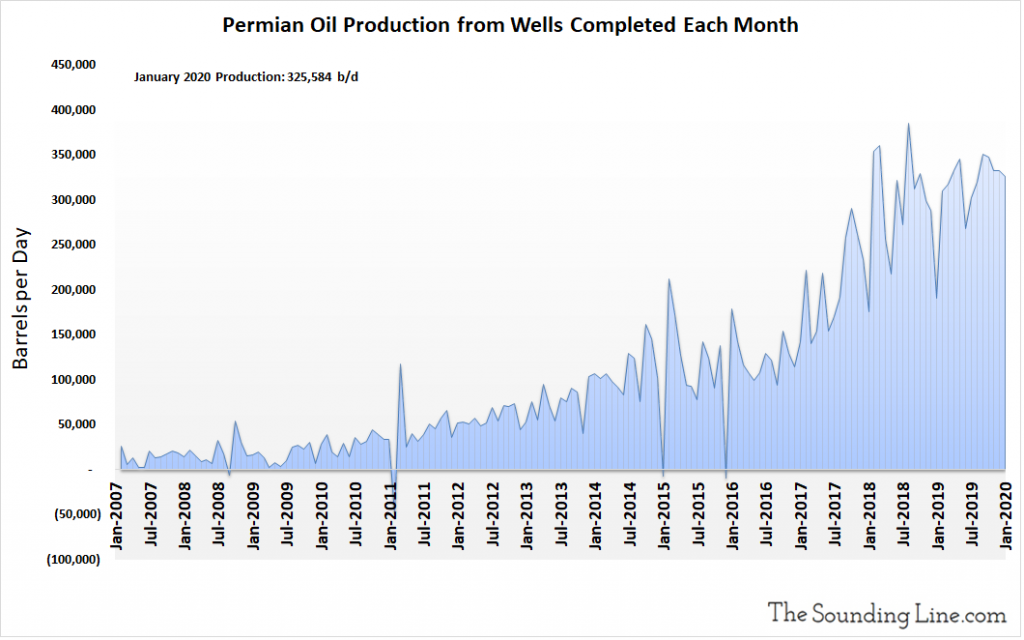
Oil Production from Wells Completed Each Month
The following chart shows the oil production from just those wells that were completed in any given month. That may include wells that were previously DUC wells, but that were completed that month. Production from newly completely wells was 325,584 b/d as of January 2020. This metric hit an all-time high of 384,532 in August 2018 and remains near those levels. Production from newly completed wells has grown robustly since the rig count and drilling expansion that started in early 2017.
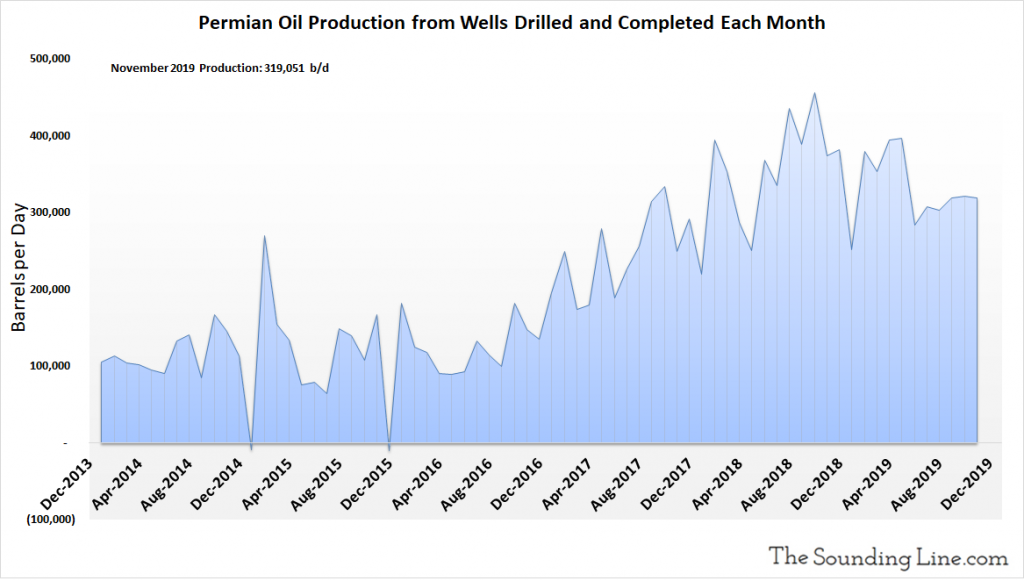
Oil Production from Wells Drilled and Completed Each Month, Excluding DUC Wells
The following chart excludes production from DUC wells that were completed in a given month and shows the production just from wells drilled and completed each month. It is an inferred number based on changes in production, legacy production, drilled wells, and completed wells. For months where the number of DUC wells increased, the implied production potential of those wells is included in the production figure even though that oil was not yet produced. Production from newly drilled and completed wells was 319,051 b/d as of November 2019. This metric peaked in August 2018 and has been trending lower since then as the rig count and drilling activity has slowed modestly.
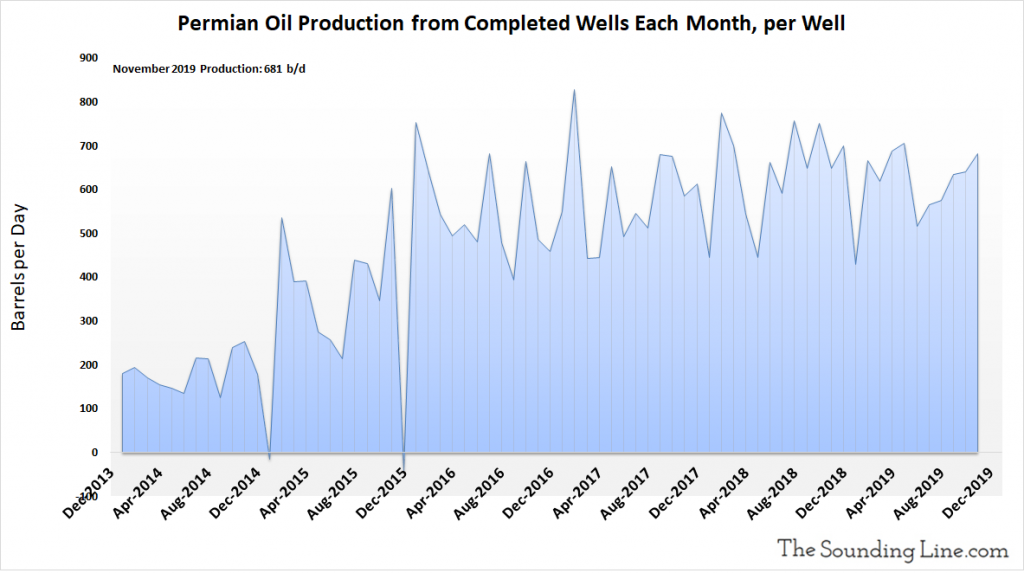
Oil Production per Well Completed Each Month
The following chart shows the oil production just from newly completed wells, per well, per month, including DUC wells that were completed. Production per completed well was 681 b/d as of November 2019. This metric has shown no clear trend of increasing since peaking at 828 b/d in February 2017. Critically, this means that the huge oil production gains in the Permian basin since 2017 have been driven by increased drilling activity and completions of DUC wells, not from increasing productivity per new well.
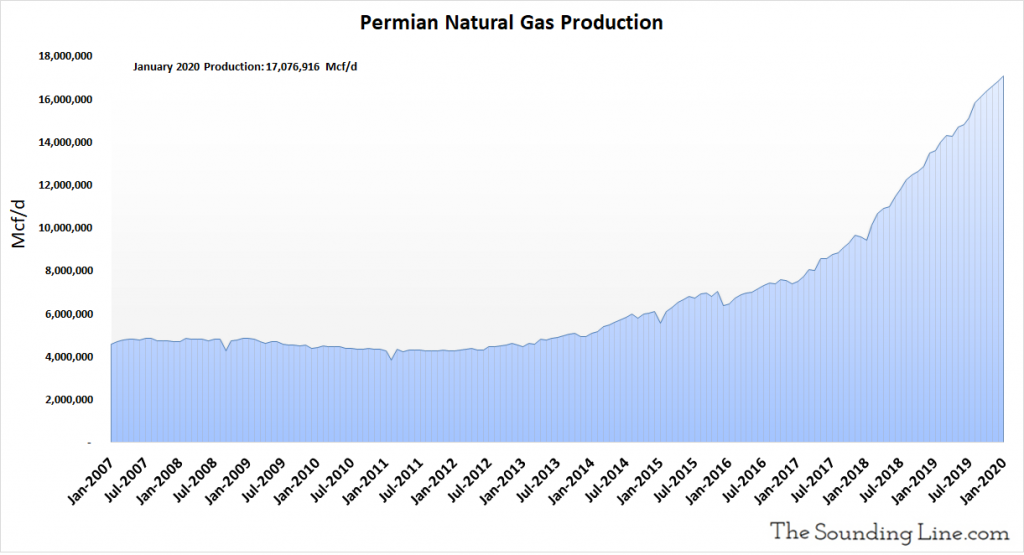
Natural Gas Production
Natural gas production in January 2020 hit an all-time record high of slightly above 17 million Mcf/d. Natural gas production has been surging since drilling activity accelerated in early 2017.
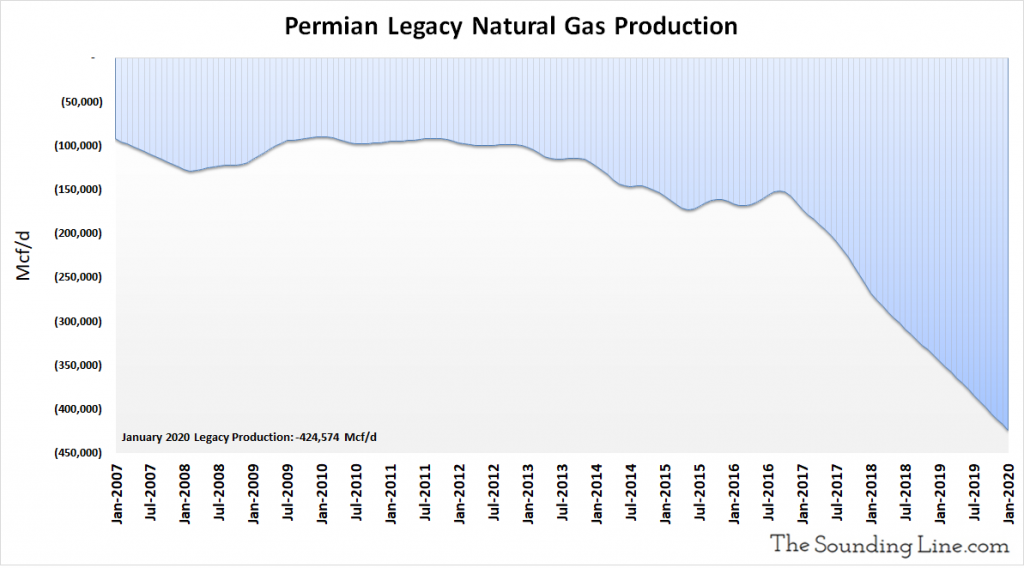
Legacy Natural Gas Production
As with legacy oil production, the following chart shows the production decline rate of wells older than a month. That decline rate reached an all-time high of -424,574 Mcf/d in January 2020.
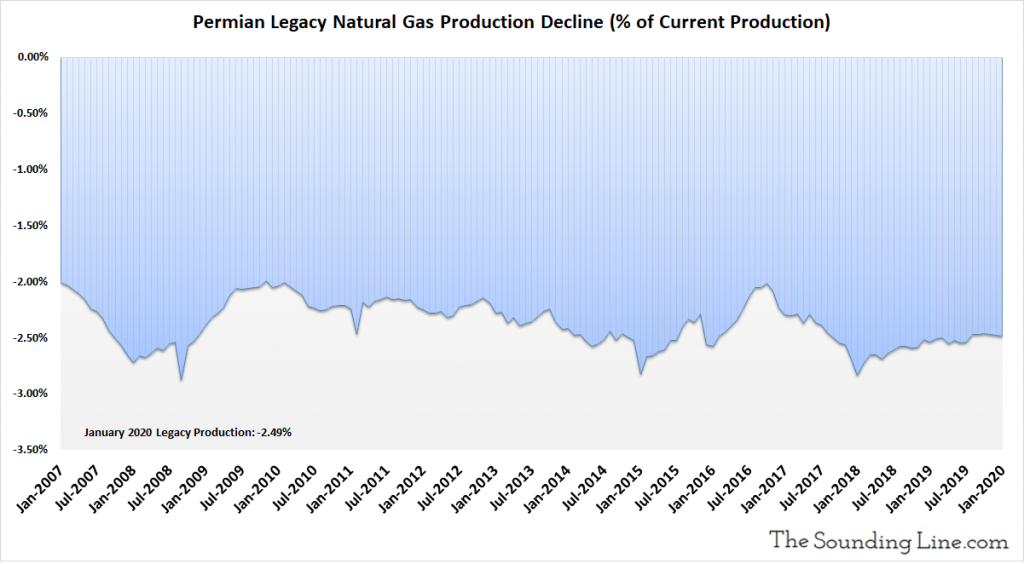
As a percent of total production, legacy declines were just -2.49% of production in January 2020. Relative to production, legacy declines in natural gas production have been remarkably stable since 2007.
Gas Production from Wells Completed Each Month
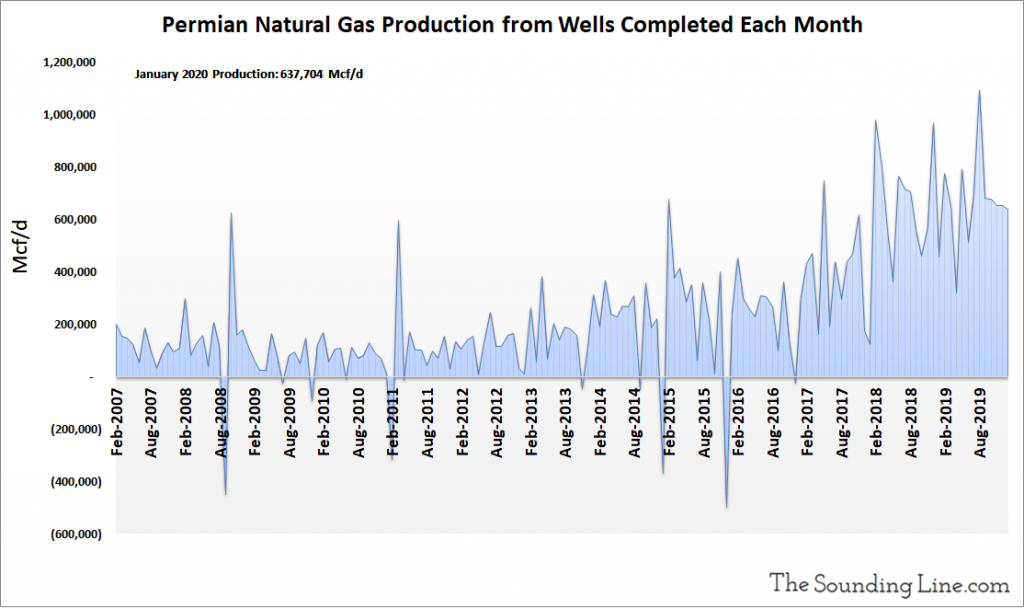
The following chart shows natural gas production from just those wells that were completed in any given month. That may include wells that were previously DUC wells. Production from newly completely wells was 637,704 Mcf/d as of January 2020. This metric has declined modestly since early 2019 but has show strong growth since the uptick in drilling activity that started in early 2017.
Gas Production from Wells Drilled and Completed Each Month, Excluding DUC Wells
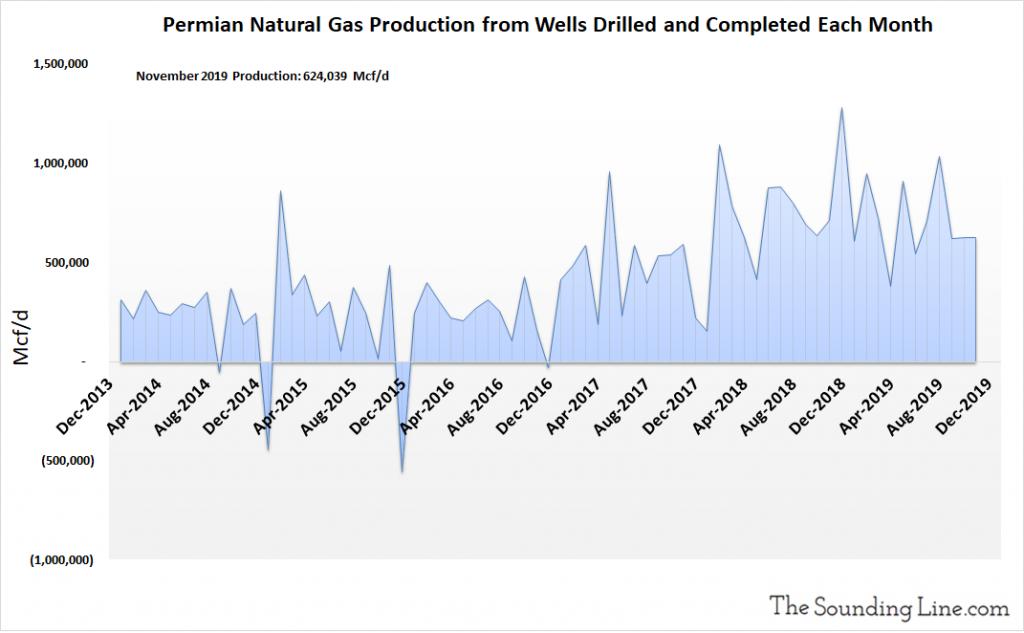
The following chart excludes production from DUC wells completed in a given month and shows the production just from wells drilled and completed each month. It is an inferred number based on changes in production, legacy production, drilled wells, and completed wells. For months where the number of DUC wells increased, the implied production potential of those wells is included in the production figure, even though that gas was not yet produced. Production from newly completely wells was 624,039 Mcf/d as of January 2020. This metric has declined modestly since late 2018 as drilling activity has slowed.
Gas Production from Wells Completed Each Month, per Well
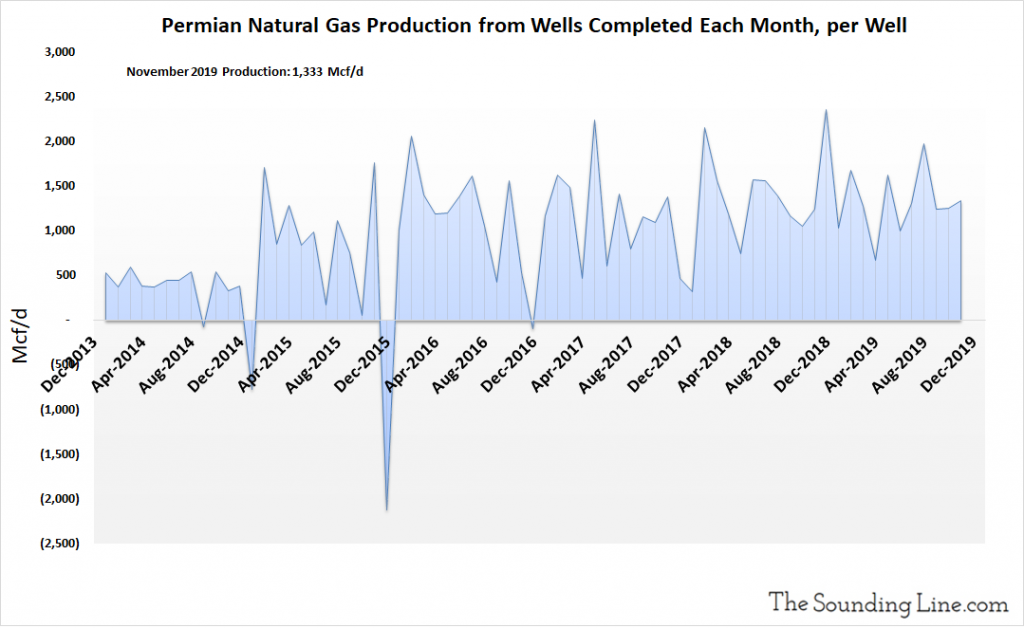
Natural gas production each month from newly completed wells, per well, was 1,333 Mcf/d as of November 2019. There has been no clear trend of improvement in this metric since at least 2016. Critically, this means that increasing natural gas production in the Permian is a result of drilling activity and completions of DUC wells, not higher productivity per well.
Some Thoughts
The Permian basin is by far the largest US oil and gas shale basin and it has been responsible for the lion’s share of US oil and gas production growth in recent years.
As has been the case with nearly every basin that we have examined, virtually 100% of production gains in the Permian in recent years have been a result of increasing drilling activity, not increasingly productive wells. Oil and gas production per newly completed well has been flat for years.
Like in the other shale basins, rig counts and drilling activity in the Permian have been declining over the past year amid very low oil and gas prices. Record high oil and gas production is being maintained by burning through the finite inventory of DUC wells. That inventory remains very large in the Permain basin, implying that production may remain strong for a long time despite the current decline in drilling. However, some analysts believe that the EIA’s DUC well figures may be heavily inflated.
While Permian production may continue to rise on the back of DUC well completions for quite some time, unless the rig count rises again, current production levels are unsustainable in the longer run.
Would you like to be notified when we publish a new article on The Sounding Line? Click here to subscribe for free.
Would you like to be notified when we publish a new article on The Sounding Line? Click here to subscribe for free.

