Submitted by Taps Coogan on the 21st of November 2016 to The Sounding Line.
Enjoy The Sounding Line? Click here to subscribe for free.
The US Presidential election has finally ended and produced a winner: Donald Trump. And so it is time to look beyond the election news cycle and take stock of the world that President-Elect Donald Trump will be inheriting.
What better place to start then automotive production, an economic metric that likely resonates with many of the working class voters who propelled Trump to the Whitehouse.
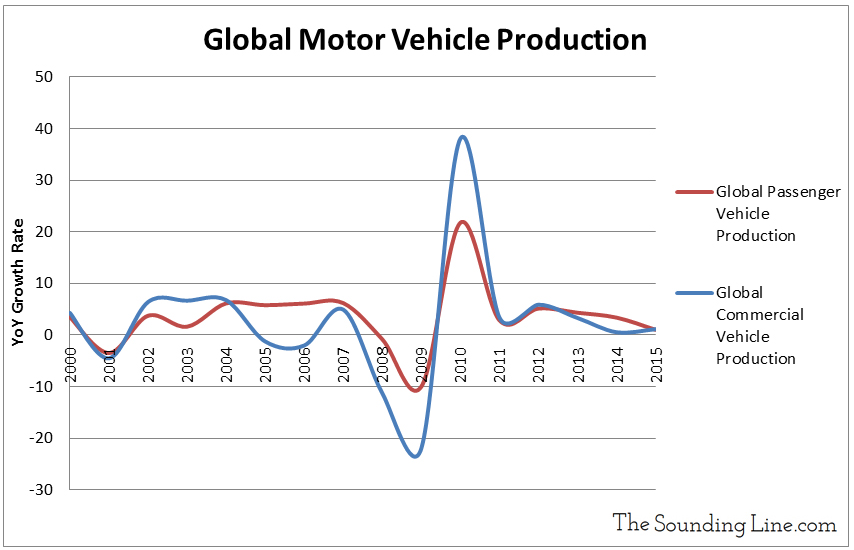
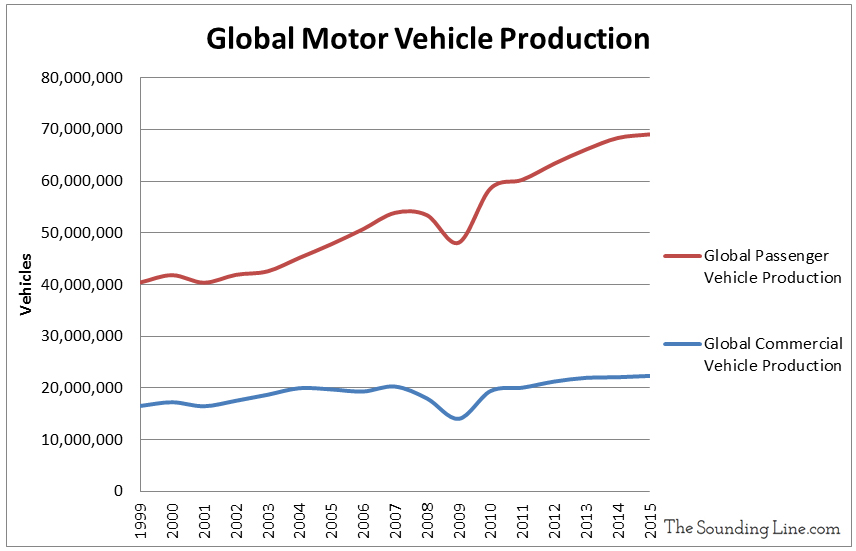
As the charts below show, global motor vehicle production has hit a ceiling. The year-over-year (YoY) growth rate in global production in the two main categories of motor vehicles: passenger cars and commercial vehicles, hit a low of 1% in 2015. The only time global production growth has been slower was during the 2001 and 2009 recessions.
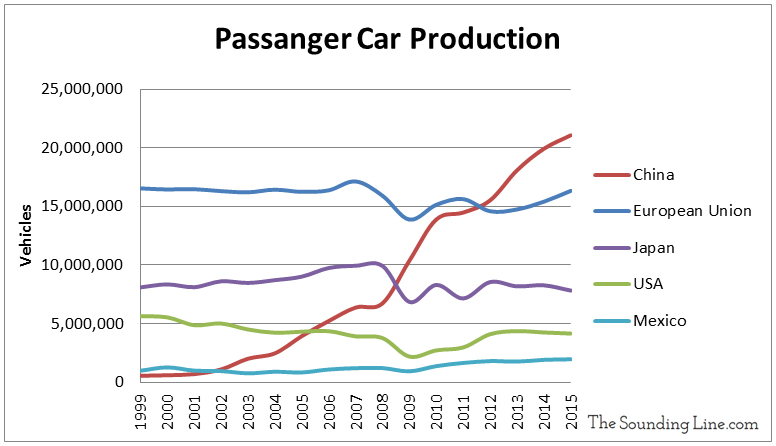
Looking at passenger vehicle production specifically, we can see in the chart below that the overwhelming majority of all production growth since 2009 can be attributed to China, which surpassed the EU in 2011 to become the world’s largest producer. Since 2009 China has increased its automotive production by an amount larger than the entire 2015 production of the US, Japan, and Mexico combined! Evidence of a concerning trend, US, EU, and Japanese automotive production is lower today than in 1999. Meanwhile, China has enjoyed a nearly 15 fold increase in automotive production during the same period. To put this in perspective, Mexico, a popular outsourcing destination for US automakers, and China both made about 1.5 million motor vehicles in 1999. Since then, Mexico’s auto production has grown to about 3.5 million units, still well below the US, EU, and Japan, while China has surged to nearly 25 million units.
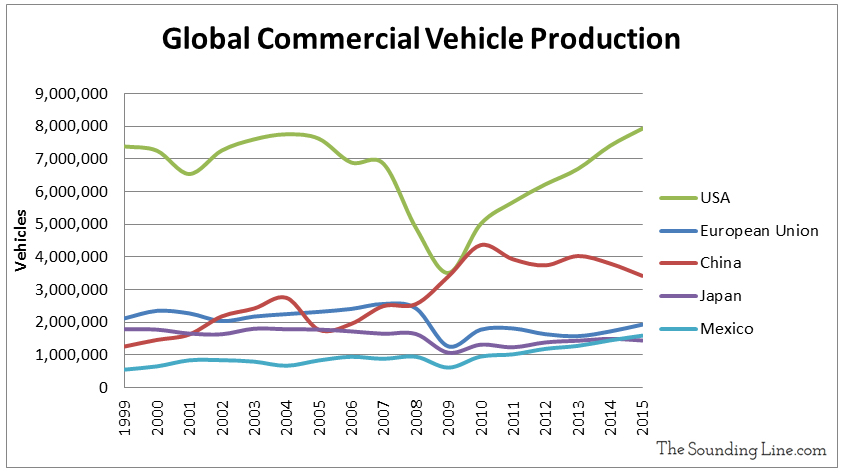
Yet looking at commercial vehicle production reveals some different trends. Compared to passenger vehicle production, Chinese commercial vehicle production is showing signs of weakness. While it looked like the Chinese would overtake US commercial production in 2010, their production has since declined by nearly one million units and as a result the US is producing more than twice the number of commercial vehicles as China.
Commercial vehicle production can be broken down into two major components: light commercial vehicles and heavy trucks. The dataset we are using from the International Organization of Motor Vehicles (IOMV) also includes buses and coaches but the number of units produced is quite small and production is narrowly distributed so we have excluded them from the analysis.
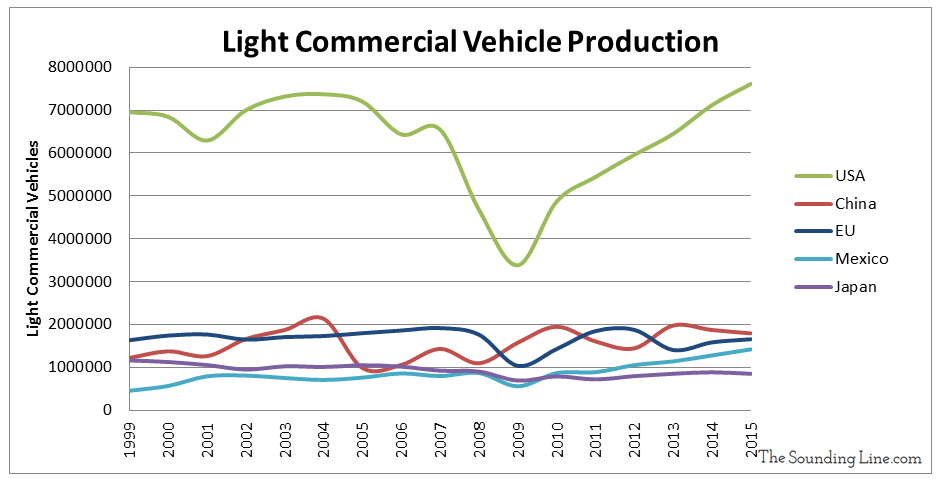
Light commercial vehicles are essentially pickup trucks and vans. In the US, pickup trucks are a popular car for individuals with no commercial intent and subsequently light commercial vehicle production is actually the largest component of US production, surpassing passenger vehicles and heavy trucks. Seeing light commercial vehicle sales rise in the US likely has more to do with consumers choosing more expensive pickup trucks as their personal cars than anything relating to commercial activity. In fact, the bestselling car in the US since 1977 has been the Ford F-150, a pickup truck and ‘light commercial vehicle.’ This phenomenon is much less prominent in China and elsewhere. In 2015 the Chinese only bought 330,000 pickup trucks to America’s 1.5 million.
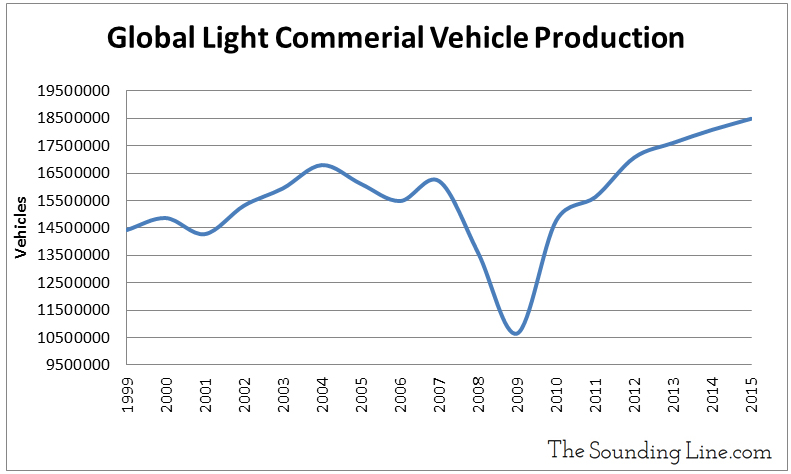
As shown below, global light commercial vehicles production has seen a relatively robust recovery from the 2009 recession lows. However, when we break production down by country, we can see that it is the US, not China, which accounts for virtually all of the decline and subsequent recovery in light commercial production.
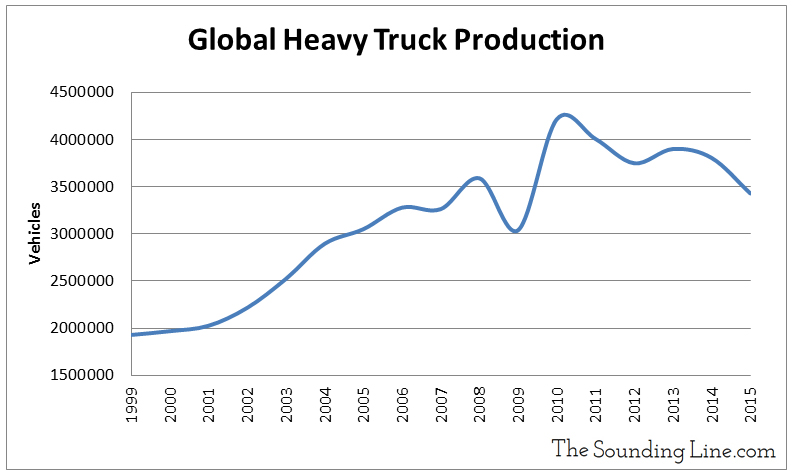
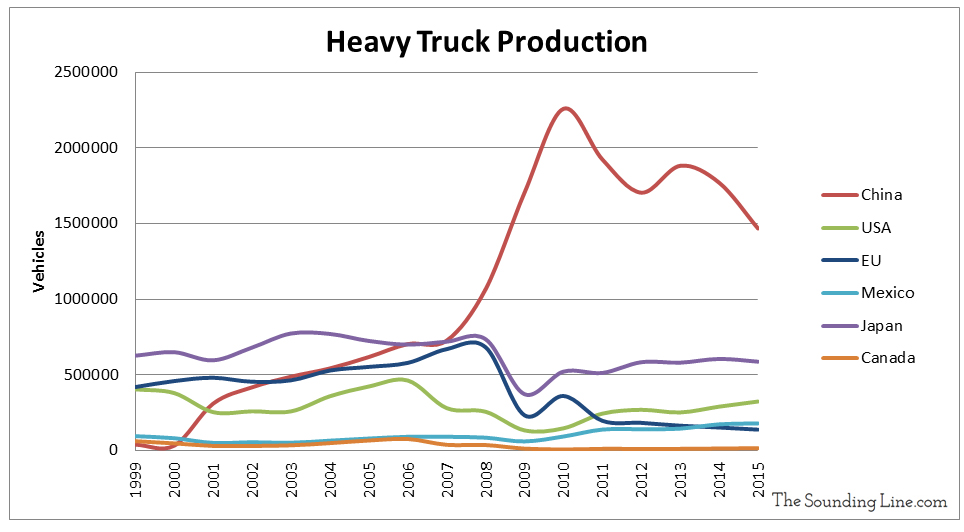
The second element of commercial vehicle production, heavy trucks, tells perhaps the most concerning tale of all. Heavy trucks are the large tractor trailer vehicles you see on the highways that pull trailers and move goods. As shown in the chart below global heavy truck production has been declining since 2010. Led by China and the EU, production by all major producers, except Mexico, has been suppressed for the last 5 to 10 years. The EU alone has seen a shocking 80% reduction in heavy truck production since 2008.
Taking all of this data together the following conclusions become apparent:
1.) Global passenger vehicle production growth remains low but positive. Underlying the trend has been phenomenal growth in Chinese passenger vehicle production and consumption as credit remains cheap globally and automakers increasingly look to China to manufacture automobiles for the global market. Little to no long term growth has occurred in the US, Japan, and the EU.
2.) Global light commercial vehicle production growth remains similarly low but with stronger US production dominating the segment and constituting the bulk of the production recovery since 2009.
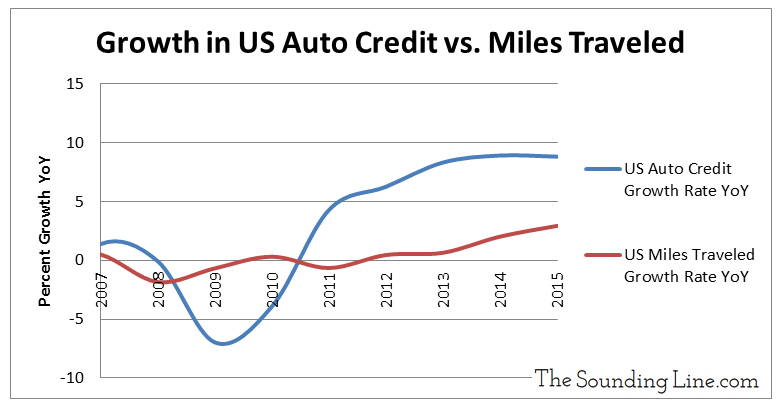
3.) Global heavy truck production is declining, particularly in the EU and China. This is perhaps the most concerning indictor for the global economy. How long can consumers continue to support growth in passenger and light commercial vehicle markets if the underlying economy as measured by the trucks required to ship goods to market is deteriorating? Certainly cheap credit has helped, but US automobile credit has grown by 37% percent since 2009 surpassing a trillion dollars for the first time ever in 2015 while the actual miles traveled by US drivers has only increased by 6% over the same time period. At some point a practical limit will be reached and that point appears increasingly near. The chart below shows that US auto credit growth has plateaued since 2013.
While long overdue structural changes may now be coming to the US economy as a result of the recent election, the global outlook is much less certain and global passenger vehicle production seems unsustainably high.
Would you like to be notified when we publish a new article on The Sounding Line? Click here to subscribe for free.

