Taps Coogan – February 16th, 2022
Enjoy The Sounding Line? Click here to subscribe for free.
Enjoy The Sounding Line? Click here to subscribe for free.
There is an argument to say that official inflation measures like CPI are likely to peak in the coming months as the year-over-year comparison comes up against already-hot months from 2021, the helicopter money runs dry, and some supply chain issues moderate.
If that’s true, the next question becomes how quickly official inflation measures will fall back to 2%. In assessing that question, the single most important factor is housing and rent inflation – the largest single component of CPI inflation, responsible for about 32% of the calculation.
As Wolf Richter details in an excellent article at Wolf Street, and as we’ve discussed many times, there are two measures of housing/rent in the CPI calculation: Rent of Primary Residence and Owner’s Equivalent of Rent. Both are terribly long lagging measures of housing inflation.
What are these housing/rent measures?
Rent of Primary Residence aims to measure rent inflation. It looks at not just asking rents for new tenants – which have skyrocketed in the last year – but existing rents as well. Because many existing rentals are under rent control or contracts that limit how fast rents can be raised, Rent of Primary Residence lags increases in asking rents for new renters.
Owner’s Equivalent of Rent is a bizarre concoction that was created in the early 1980s, coincidently when CPI inflation was just as high as it is today. The desire at the time was to remove home prices from the CPI calculation while still having something that captured home prices. There are two arguments as to why this was done. The official reason for the change was that a house is an asset, not a consumable good or service, and thus doesn’t represent consumer inflation so much as asset price inflation. The competing explanation was that officials desperately wanted to lower inflation in the early 1980s and so removed one of the biggest contributors to inflation at that time: home prices. The reader can decide which explanation makes the most sense but note that the BLS didn’t just remove housing costs and call it a day; they replaced it with something designed to replicate home prices, but lower.
Owner’s Equivalent of Rent surveys home owners who don’t rent their homes and asks them how much they would charge for rent in the hypothetical scenario where they rented their home. That data is then massaged into a number to capture housing costs, all to avoid just using home prices. True to its design, it badly lags (and understates) increases in home prices and rents.
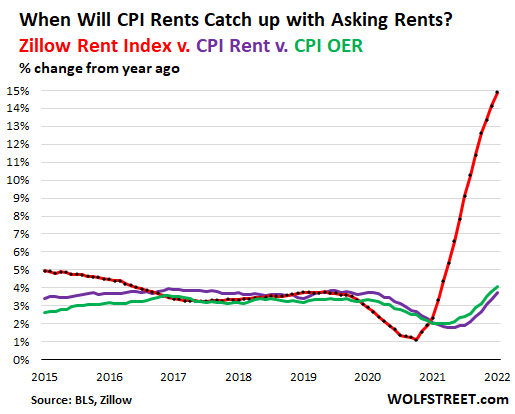
Long story short, both rent/housing inflation numbers in the CPI infamously lag increases in asking rents and home prices, as the following chart from Wolf Richter highlights.

Wolf Richter goes on to calculate that both factors are likely to push up overall CPI by an additional 1.1% in both 2022 and 2023 (and PCE by 0.5%). To be clear as to what that means, if rent/housing prices were frozen where they are today, just the process of these components catching up to today’s asking rents would push overall CPI up by another 1.1% for two years.
In other words, for CPI or PCE to get back to 2%, the rate of inflation for the other components (autos, food, healthcare, etc…) is going to have to drop precipitously. That seems unlikely outside of a recession, so until a recession starts coming more clearly into focus, don’t expect inflation to get back to target.
Would you like to be notified when we publish a new article on The Sounding Line? Click here to subscribe for free.
Would you like to be notified when we publish a new article on The Sounding Line? Click here to subscribe for free.

